
Page 238 - Process Modelling and Simulation With Finite Element Methods
P. 238
Geometric Continuation 225
RAM memory. In my m-file script for this problem, 1 perform two mesh
refinements, yielding over 4000 elements. This may be a significant inducement
to run it in the background!
Eventually, Table 6.1 is generated by the results of this geometric
continuation study.
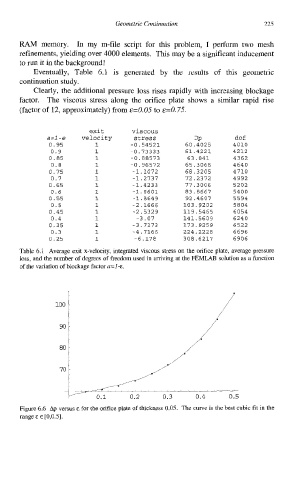
Clearly, the additional pressure loss rises rapidly with increasing blockage
factor. The viscous stress along the orifice plate shows a similar rapid rise
(factor of 12, approximately) from &=O.05 to &=0.75.
exit viscous
a=l -e velocity stress DP dof
0.95 1 -0.54521 60.4025 4010
0.9 1 -0.73333 61.4221 4212
0.85 1 -0.88573 63.041 4362
0.8 1 -0.96572 65.3066 4640
0.75 1 -1.1072 68.3205 4710
0.7 1 -1.2731 72.2372 4992
0.65 1 -1.4233 77.3006 5202
0.6 1 -1.6601 83.8667 5400
0.55 1 -1.8649 92.4607 5594
0.5 1 -2.1666 103.9202 5804
0.45 1 -2.5329 119.5465 6054
0.4 1 -3.07 141.5609 6240
0.35 1 -3.7173 173.9259 6522
0.3 1 -4.7166 224.2228 6696
0.25 1 -6.118 308.6217 6906
Table 6.1 Average exit x-velocity, integrated viscous stress on the orifice plate, average pressure
loss, and the number of degrees of freedom used in arriving at the FEMLAB solution as a function
of the variation of blockage factor a=]-&.
Figure 6.6 Ap versus E for the orifice plate of thickness 0.05. The curve is the best cubic fit in the
range E E [0,0.5].