
Page 126 - Radar Technology Encyclopedia
P. 126
116 detection, coherent detection, distribution-dependent
hence there is no gain in SNR. To produce coherent integra- Detection criteria are the mathematical rules used to make a
tion gain for targets of unknown doppler shift, there must be decision as to signal presence or absence in the radar return.
multiple filters covering all or most of the ambiguous doppler See Bayes detection criterion (minimum average risk), ideal
interval f . Such operation is characteristic of the pulse dop- observer detection criterion, likelihood ratio detection cri-
r
pler signal processor, the low-PRF version of which is known terion, minimax detection criterion, Neyman-Pearson
as the moving-target detector (MTD). When MTI or MTD detection criterion, sequential observer detection crite-
radars are operated with clutter rejection notches (blind rion, and weighting detection criterion. From the point of
speeds) in the response near-zero doppler, they will inevitably view of practicality, the Neyman-Pearson and weighting
lose targets in that region (and often at ambiguous blind detection criteria are the most convenient. AIL
speeds as well), incurring a velocity response loss that can be Ref.: DiFranco (1968), Ch. 8; Kazarinov (1990), pp. 24–26.
large when high values of detection probability are required.
correlation detection (see coherent detection).
SAL
Cumulative detection is based on making an independent
Ref.: Skolnik (1980), p. 385; Shirman (1970), pp. 100–109; Blake (1980),
p. 55; Barton (1988), p. 69; Sosulin (1992), pp. 59–63; Scheer (1993). decision on each of n signal samples and is equivalent to m-
out-of-n detection (binary integration) with m = 1. The cumu-
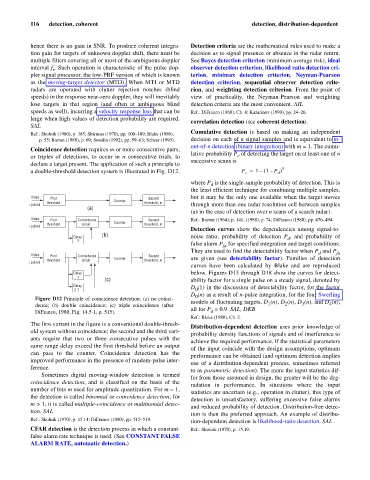
Coincidence detection requires m or more consecutive pairs,
lative probability P of detecting the target on at least one of n
c
or triples of detections, to occur in n consecutive trials, to
successive scans is
declare a target present. The application of such a principle to
n
a double-threshold detection system is illustrated in Fig. D12. P = 1 – ( 1 – P )
d
c
where P is the single-sample probability of detection. This is
d
the least efficient technique for combining multiple samples,
Video First Second but it may be the only one available when the target moves
threshold Counter threshold, m
n pulses through more than one radar resolution cell between samples
(a)
(as in the case of detection over n scans of a search radar).
Video First Coincidence Second Ref.: Barton (1964), p. 141, (1988), p. 74; DiFranco (1980), pp. 476–494.
threshold circuit Counter threshold, m
n pulses
Detection curves show the dependencies among signal-to-
(b)
Delay noise ratio, probability of detection P , and probability of
d
T
false alarm P for specified integration and target conditions.
fa
They are used to find the detectability factor when P and P
Video First Coincidence Second d fa
threshold circuit Counter threshold, m are given (see detectability factor). Families of detection
n pulses
curves have been calculated by Blake and are reproduced
Delay below. Figures D13 through D18 show the curves for detect-
T
(c) ability factor for a single pulse on a steady signal, denoted by
Delay D (1) in the discussion of detectability factor, for the factor
T 0
2
D (n) as a result of n-pulse integration, for the four Swerling
0
Figure D12 Principle of coincidence detection: (a) no coinci- models of fluctuating targets, D (n), D (n), D (n), and D (n),
dence; (b) double coincidence; (c) triple coincidence (after 1 2 3 4
all for P = 0.9. SAL, DKB
DiFranco, 1980, Fig. 14.5-1, p. 515). d
Ref.: Blake (1980), Ch. 2.
The first variant in the figure is a conventional double-thresh-
Distribution-dependent detection uses prior knowledge of
old system without coincidence; the second and the third vari-
probability density functions of signals and of interference to
ants require that two or three consecutive pulses with the
achieve the required performance. If the statistical parameters
same range delay exceed the first threshold before an output
of the input coincide with the design assumptions, optimum
can pass to the counter. Coincidence detection has the
performance can be obtained (and optimum detection implies
improved performance in the presence of random-pulse inter-
use of a distribution-dependent process, sometimes referred
ference.
to as parametric detection). The more the input statistics dif-
Sometimes digital moving-window detection is termed
fer from those assumed in design, the greater will be the deg-
coincidence detection, and is classified on the basis of the
radation in performance. In situations where the input
number of bits m used for amplitude quantization. For m = 1,
statistics are uncertain (e.g., operation in clutter), this type of
the detection is called binomial or coincidence detection; for
detection is unsatisfactory, suffering excessive false alarms
m > 1, it is called multiple-coincidence or multinomial detec-
and reduced probability of detection. Distribution-free detec-
tion. SAL
tion is then the preferred approach. An example of distribu-
Ref.: Skolnik (1970), p. 15.14; DiFranco (1980), pp. 515–519. tion-dependent detection is likelihood-ratio detection. SAL
CFAR detection is the detection process in which a constant- Ref.: Skolnik (1970), p. 15.19.
false-alarm rate technique is used. (See CONSTANT FALSE
ALARM RATE, automatic detection.)