
Page 128 - Radar Technology Encyclopedia
P. 128
118 detection, distribution-free detection criterion, maximum-likelihood
Distribution-free detection does not require prior knowl- tion is likelihood-ratio detection using the Neyman-Pearson
edge of probability density functions for signal or interfer- detection criterion. SAL
ence. Typically it is described as CFAR detection, because it Ref.: Skolnik (1970), p. 15.4.
maintains a constant false-alarm rate. Because it makes no
The ideal observer detection criterion is the optimum crite-
use of input statistical distributions, it has greater loss than
rion, giving the minimum sum of erroneous decision proba-
optimum detection. One form of distribution-free detection is
bilities. To apply the criterion, one must know a priori the
rank-order detection, which uses the ranks of observed inputs
probability of target presence P in the specified area and a
a
(e.g., their order of amplitudes) and bases detection on some
priori probability of target absence q = 1 - P . Then the
a
a
function of those ranks. Distribution-free detection is also
probability of erroneous “target present” decisions is q P ,
a fa
called nonparametric detection, and it is the preferred proce-
where P is the false-alarm probability, and the probability of
fa
dure when the statistics of input interference are unknown
erroneous “target absent” decisions is P P , where P is the
tm
a tm
(e.g., when operating in nonhomogeneous and nonstationary
probability of missing the target. According to ideal observer
clutter). SAL
criterion, the best detector gives the minimum sum of the
Ref.: Skolnik (1970), p. 15.27, (1980), p. 393.
erroneous decisions P S
Double-threshold detection is the process that requires a sig- P = q P + P P = min
a m
a fa
S
nal to exceed two thresholds to make a final decision as to In Russian radar literature, this criterion is often termed the
signal presence. Typically, the signal is first screened by a Kotel’nikov criterion. AIL
binary threshold whose level is low enough to pass very weak Ref.: DiFranco (1968), p. 271; Kazarinov (1990), p. 25.
echoes and many noise peaks. After storage of the resulting
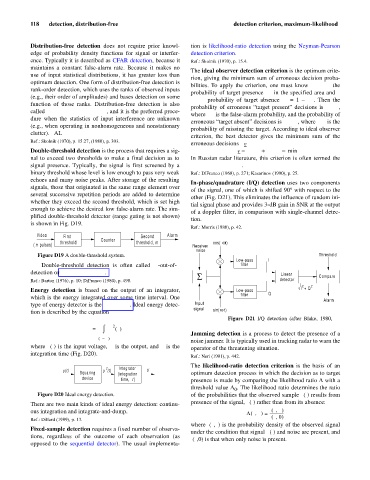
In-phase/quadrature (I/Q) detection uses two components
signals, those that originated in the same range element over
of the signal, one of which is shifted 90° with respect to the
several successive repetition periods are added to determine
other (Fig. D21). This eliminates the influence of random ini-
whether they exceed the second threshold, which is set high
tial signal phase and provides 3-dB gain in SNR at the output
enough to achieve the desired low false-alarm rate. The sim-
of a doppler filter, in comparison with single-channel detec-
plified double-threshold detector (range gating is not shown)
tion. SAL
is shown in Fig. D19.
Ref.: Morris (1988), p. 42.
Video First Second Alarm
threshold Counter threshold, m cos( t)
w
n ( pulses) Receiver
noise
Figure D19 A double-threshold system. Threshold
Low-pass I
Double-threshold detection is often called m-out-of-n filter
detection or binary integration. SAL Linear
S Compare
Ref.: Barton (1976), p. 10; DiFranco (1980), p. 498. detector
2 I + Q 2
Energy detection is based on the output of an integrator, Low-pass
filter Q
which is the energy integrated over some time interval. One Alarm
type of energy detector is the radiometer. Ideal energy detec- Input
signal sin( t)
w
tion is described by the equation
Figure D21 I/Q detection (after Blake, 1980,
t
2
V = ò y r () r
d
Jamming detection is a process to detect the presence of a
–
( tT )
noise jammer. It is typically used in tracking radar to warn the
where y(t) is the input voltage, V is the output, and T is the operator of the threatening situation. SAL
integration time (Fig. D20).
Ref.: Neri (1991), p. 442.
The likelihood-ratio detection criterion is the basis of an
2 Integrator
y(t) y (t) V
Squaring (integration optimum detection process in which the decision as to target
device time, ) presence is made by comparing the likelihood ratio L with a
t
threshold value L . The likelihood ratio determines the ratio
0
Figure D20 Ideal energy detection. of the probabilities that the observed sample y(t) results from
There are two main kinds of ideal energy detection: continu- presence of the signal, u(t) rather than from its absence:
fy u )
(
,
ous integration and integrate-and-dump. SAL L yu ) ---------------
,
(
=
,
(
Ref.: Dillard (1989), p. 13. fy 0 )
where f(y,u) is the probability density of the observed signal
Fixed-sample detection requires a fixed number of observa-
under the condition that signal u(t) and noise are present, and
tions, regardless of the outcome of each observation (as
f(y,0) is that when only noise is present.
opposed to the sequential detector). The usual implementa-