Page 127 - Radar Technology Encyclopedia
P. 127

detection curves                                                                  detection curves  117


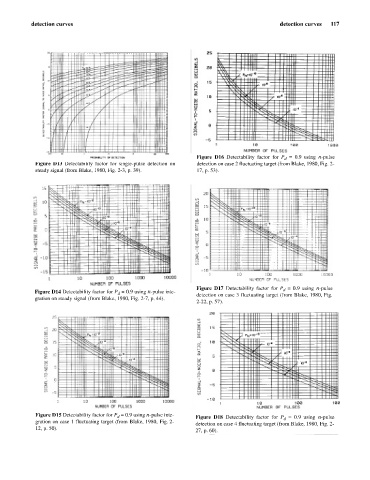
                                                                  Figure D16  Detectability factor  for  P  = 0.9 using  n-pulse
                                                                                               d
             Figure D13 Detectability factor for single-pulse detection on  detection on case 2 fluctuating target (from Blake, 1980, Fig. 2-
             steady signal (from Blake, 1980, Fig. 2-3, p. 39).   17, p. 53).


                                                                  Figure D17  Detectability factor for  P  =  0.9 using  n-pulse
                                                                                               d
             Figure D14 Detectability factor for P  = 0.9 using n-pulse inte-  detection on case 3 fluctuating target (from Blake, 1980, Fig.
                                        d
             gration on steady signal (from Blake, 1980, Fig. 2-7, p. 44).
                                                                  2-22, p. 57).


             Figure D15 Detectability factor for P  = 0.9 using n-pulse inte-
                                        d                         Figure D18  Detectability factor for  P  = 0.9  using  n-pulse
                                                                                               d
             gration on case 1 fluctuating target (from Blake, 1980, Fig. 2-
                                                                  detection on case 4 fluctuating target (from Blake, 1980, Fig. 2-
             12, p. 50).
                                                                  27, p. 60).
   122   123   124   125   126   127   128   129   130   131   132