
Page 247 - Radar Technology Encyclopedia
P. 247
237 lens, metal-plate likelihood ratio
made of different materials. It always is very important to
L ensure the minimum degree of coupling between input and
1
L
n
output arrays. Element coupling depends on the curve and
y shape of the array surface. The greater the curve, the greater
the link between elements. The ratio g /f is the measure of
L L
the input grid curve, while the ratio of the depth of the output
F F
1 1
array to its length is the measure of the output array curve.
(See also ARRAY, Rotman.) AIL
(a) (b) Ref.: Johnson (1984), p. 16.19; Barton (1988), pp. 178–179; Mailloux
(1994), pp. 505–511.
Figure L6 Metal-plate lenses: (a) waveguide, (b) stepped The R-KR lens is a two-dimensional bootlace lens with the
Fresnel (from Leonov, 1986, Fig. 2.7, p. 19). feedpoints and the inner surface on a circle of radius R and
the outer surface on a radius KR, with equal line length
beams in the lens is reduced. Without disruption of the phase between the inner and outer surface radiators. It provides
coincidence of the wavefront at lens output, plate thickness nearly linear wavefront over an arc of approximately 120° .
may be decreased to the magnitude in the center of the lens Beams covering 360° can be obtained simultaneously by add-
and, consequently, to decrease weight and losses in the lens. ing a circulator in each line. A special case is the R-2R lens.
Fresnel lens shortcomings include energy losses, increased SAL
level of sidelobes caused by shading due to the steps, and
Ref.: Johnson (1984), p. 16.22.
increased lens sensitivity to a change in frequency. AIL
The Schmidt lens is a scanning antenna configuration in
Ref.: Leonov (1984), p. 19; Johnson (1984), pp. 16.12–16.17.
which a hemispherical reflector is combined with a correcting
A Rotman lens is a metal-plate waveguide lens with several lens that passes through the center of the sphere from which
feeds. Flat waveguides are used in which the wave is propa- the hemisphere was derived. SAL
gated with a phase velocity, v , given in. (1) above, where L 1 Ref.: Johnson (1984), p. 18.13.
f
is the distance between waveguides (l/2 < L < l). Conse-
1
quently, always v > c and the lens index of refraction is A waveguide lens is one using waveguide as the propagation
f
n = c/v < 1, (i. e., the lens is an acceleration lens). A Rotman medium to constrain rays to paths parallel to the waveguide
f
lens (Fig. L7) is a device comprising an input radiator array axis. SAL
and a waveguide lens (output array). Movement of the radia- Ref.: Johnson (1984), p. 16.12.
tors relative to lens axis makes it possible to shape several LIKELIHOOD
beams at different angles to the lens axis.
The likelihood function is the conditional functional of the
probability density W(y(t)|H ), determined on the condition
i
that the hypothesis H is true, and viewed as a function of the
i
1 number of the hypothesis i with fixed samples of y(t). Pres-
2 f L ence of a class of target from which the signal y(t) is received,
Inputs 3
a b or the value of the measured target parameter, may serve as
g the hypothesis.
L
The ratio of the values of the likelihood functions for two
analyzed hypotheses is called the likelihood ratio. The deci-
N sion is made on the basis of a comparison of the likelihood
ratio with the threshold. Typically, this procedure is the basis
d Radiating
Input Output array for design of optimal (or quasioptimal) devices for measure-
array array
elements elements ment, detection, and discrimination of radar targets. IAM
Ref.: Urkowitz (1983), p. 536; DiFranco (198), p. 232; Kazarinov (1990), p.
30.
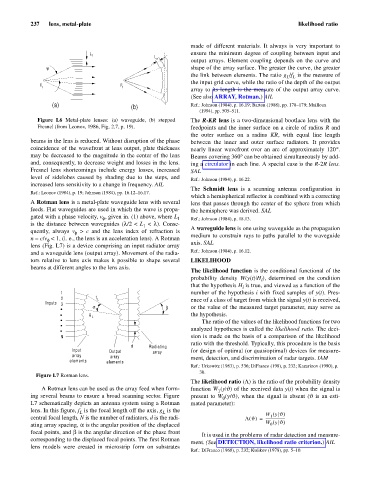
Figure L7 Rotman lens.
The likelihood ratio (L) is the ratio of the probability density
A Rotman lens can be used as the array feed when form- function W (y|J) of the received data y(t) when the signal is
1
ing several beams to ensure a broad scanning sector. Figure present to W (y/J), when the signal is absent (J is an esti-
0
L7 schematically depicts an antenna system using a Rotman mated parameter):
lens. In this figure, f is the focal length off the axis, g is the
L L W y J( )
1
central focal length, N is the number of radiators, d is the radi- LJ() ---------------------
=
ating array spacing, a is the angular position of the displaced W y J( )
0
s
i
focal points, and b the angular direction of the phase front
It is used in the problems of radar detection and measure-
corresponding to the displaced focal points. The first Rotman
ment. (See DETECTION, likelihood ratio criterion.) AIL
lens models were created in microstrip form on substrates
Ref.: DiFranco (1968), p. 232; Kulikov (1978), pp. 5–10.