
Page 306 - Radar Technology Encyclopedia
P. 306
oscillator, voltage-controlled (VCO) PATTERN, antenna (radiation) 296
The backward-wave oscillator has an exponential frequency-
versus-voltage characteristic, and all others have a linear
characteristic.SAL
Ref.: IEEE (1990), p. 30; Skolnik (1990), p. 10.17.
P
(a)
PARAMETRIC ECHO EFFECT. The parametric echo
effect is the phenomenon whereby the amplitude of a radio
wave is stored in ferromagnetic samples by the accumulation
of energy in resonant elements of the magnetized sample,
which are formed on the basis of the magnetic moments of
the nuclear magnetization. The resonant frequencies of the
(b)
elements of the magnetized sample, which differ as a result of
the heterogeneity of the magnetic field, cover a specific band.
Figure P1 Example of search radar antenna patterns in princi-
Within the limits of this band it is possible to process nonsi- pal planes: (a) azimuth pattern; (b) elevation pattern.
nusoidal (linearly frequency modulated) oscillations owing to
the stored information of the signal oscillations and subse-
quent reading of the pulses with the same deviation, but with
a duration half as long. Using this same process, frequency-
modulated pulses can be compressed.
The effect can be used in analog pulse compression,
where its merit is the simplicity of its application to random
modulation of the signal. IAM
Ref.: Shirman (1974) p. 162.
PATTERN, antenna (radiation). The antenna pattern is “a
graphical representation of the radiation properties of the
antenna as a function of space coordinates.” It is usually a
plot of power gain (a dimensionless quantity) versus angular
coordinates (the power gain pattern), measured at sufficient AZIMUTH (DEG)
distance from the antenna that the gain is independent of
Figure P2 Example of antenna pattern contour plot.
range (i.e., in the far field, see ANTENNA radiation
regions). The same plot with a change of scale can represent
radiation intensity or power flux density produced at a given
range by a particular transmitter radiating through the antenna
(power per unit solid angle), or directivity, which differs from
power gain only by omission of the radiation efficiency.
Alternatively, the voltage gain (dimensionless) or the field
strength (V/m) produced by a particular transmitter radiating
through the antenna may be plotted, these also having the
same curve with a change of scale. The complete antenna pat-
tern also includes the phase, relative to a given reference
(e.g., at the beam axis), and the polarization. Since most
antennas are reciprocal, the “radiation properties” are identi-
cal to the corresponding “receiving properties” of the
antenna.
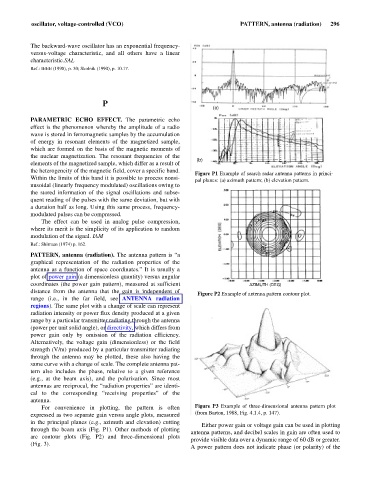
For convenience in plotting, the pattern is often Figure P3 Example of three-dimensional antenna pattern plot
expressed as two separate gain versus angle plots, measured (from Barton, 1988, Fig. 4.1.4, p. 147).
in the principal planes (e.g., azimuth and elevation) cutting
Either power gain or voltage gain can be used in plotting
through the beam axis (Fig. P1). Other methods of plotting
antenna patterns, and decibel scales in gain are often used to
are contour plots (Fig. P2) and three-dimensional plots
provide visible data over a dynamic range of 60 dB or greater.
(Fig. 3).
A power pattern does not indicate phase (or polarity) of the