Page 85 - Radar Technology Encyclopedia
P. 85

channel, radar                                                                        chart, Blake  75


           through the interaction of electromagnetic waves radiated by  viewpoint, to optimize performance of the radar, and to sim-
           the antenna with  the radar target.  The information is trans-  plify estimation of radar characteristics during preliminary
           ported by an electromagnetic field (space-time process) to the  design and experimentation. IAM
           radar receiver, in which it is transformed into a radar signal  Ref.: Tuchkov (1985), p. 11.
           (time process).
                                                                sum channel (see MONOPULSE).
               The radar channel may be analyzed through a description
           of  the transformation of the signal characteristics  along the  CHART
           transmitter-target-receiver path, using quantitative estimates
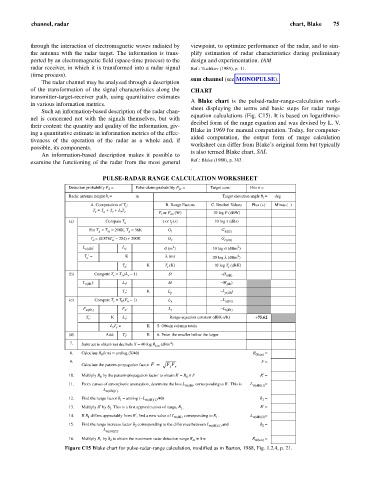
                                                                A  Blake chart is  the pulsed-radar-range-calculation  work-
           in various information metrics.
                                                                sheet displaying the terms and basic  steps for radar  range
               Such an information-based description of the radar chan-
                                                                equation calculations (Fig. C15). It is based on logarithmic-
           nel is concerned not with the signals themselves, but with
                                                                decibel form of the range equation and was devised by L. V.
           their content: the quantity and quality of the information, giv-
                                                                Blake in 1969 for manual computation. Today, for computer-
           ing a quantitative estimate in information metrics of the effec-
                                                                aided computation, the output form of range calculation
           tiveness of the  operation of the radar as a whole and, if
                                                                worksheet can differ from Blake’s original form but typically
           possible, its components.                            is also termed Blake chart. SAL
               An information-based description makes  it possible to
           examine the functioning of the radar from the most general  Ref.: Blake (1980), p. 383.
                                                                .
                                   PULSE-RADAR RANGE CALCULATION WORKSHEET
                        Detection probability P d  =  False-alarm probability P fa  =  Target case:   Hits n =
                        Radar antenna height h =  m                        Target  elevation  angle q t  =  deg
                                     r
                               A. Computation of T s :  B. Range Factors  C. Decibel Values  Plus (+)  Minus (- )
                                T  = T  + T  + L T   P  or P  (W)      10 log P (dBW)
                                   a
                                      r
                                s
                                         r e
                                                         av
                                                      t
                        (a)         Compute T a        t  or t  (s)     10 log t  (dBs)
                                                          f
                               For T  = T  = 290K, T  = 36K  G t          G t(dB)
                                           g
                                     ta
                                  g
                               T  = (0.876T ¢ -         G                 G
                                        254) + 290K
                                a     a                  r                 r(dB)
                                                                               2
                            L a(dB) :    L a :         s  (m )         10  log  (dBm )
                                                          2
                                                                           s
                                                                               2
                             T ¢ =        K             l  (m)         20 log l  (dBm )
                              a
                                         T a :    K     T s  (K)       - 10 log T  (dBK)
                                                                            s
                        (b)     Compute T  = T (L  -  1)  D               - D (dB)
                                      r
                                         tr
                                           r
                            L r(dB ):    L r :           M                - M (db )
                                         T : r    K      L p              - L p(dB )
                        (c)     Compute T  = T (F  -  1)  L x             - L x(dB)
                                         0
                                           n
                                      e
                            F            F :             L                - L
                             n(dB)        n              t                 t(dB)
                             T e :    K  L r :           Range-equation constant (dBK× s/K)  +75.62
                                     L T  =       K  5. Obtain column totals
                                      r e
                        (d)         Add:  T s :   K  6. Enter the smaller below the larger
                                                         4
                        7.  Subtract to obtain net decibels X = 40 log R km  (dBm )
                        8.  Calculate R 0 (km) = antilog (X/40)                      R 0(km)  =
                        9.                                                             F =
                            Calculate the pattern-propagation factor F =  F F
                                                         t r
                                                              R
                        10.  Multiply R  by the pattern-propagation factor to obtain R¢ =   ´  F  R¢  =
                                  0                            0
                        11.  From curves of atmospheric attenuation, determine the loss L a(dB) , corresponding to R¢ . This is   L a(dB)(1) =
                                   L a(dB)(1).
                        12.  Find the range factor d 1  = antilog (- L a(dB)(1) /40)   d 1  =
                        13.  Multiply R¢  by d 1 . This is a first approximation of range, R .  R¢  =
                                                             1
                        14.  If R 1  differs appreciably from R¢ , find a new value of L a(dB)  corresponding to R 1 .  L a(dB)(2) =
                        15.  Find the range increase factor d 2  corresponding to the difference between L a(dB)(1)  and   d 2  =
                                   L    .
                                    a(dB)(2)
                        16.  Multiply R 1  by d  to obtain the maximum radar detection range R m  in km  R m(km)  =
                                     2
                      Figure C15 Blake chart for pulse-radar-range calculation, modified as in Barton, 1988, Fig. 1.2.4, p. 21.
   80   81   82   83   84   85   86   87   88   89   90