Page 92 - Radar Technology Encyclopedia
P. 92

82    clutter (amplitude) distribution                                                     clutter filter


                      1                                               0.1

                     0.8
                                                                     0.08                     a = 1
                  Probability density  0.6                          Probability density per dB  0.06

                     0.4

                     0.2                                             0.04                     a = 2
                                                                                                a = 3
                      0                                                                           a = 4
                       1   0   1   2   3   4    5   6                0.02
                                                                                                      a = 5
                             Power in units of mean power
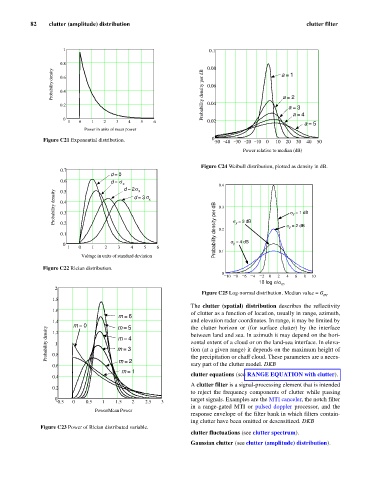
               Figure C21 Exponential distribution.                    0 50  40  30  20  10  0  10  20  30  40  50

                                                                                 Power relative to median (dB)

                                                                   Figure C24 Weibull distribution, plotted as density in dB.
                     0.7
                                      d = 0
                                      d d d
                                       = 0
                                       = 0
                                       = 0
                     0.6              d =
                                        s
                                          x
                                                                         0.4
                                          d = 2    s
                   Probability density  0.4  d = 3    x                  0.3                     s y  = 1 dB
                                               x
                     0.5
                                                 s
                     0.3
                     0.2
                     0.1                                                Probability density per dB  0.2  s y  = 3 dB  s y  = 2 dB
                      0                                                      s y  = 4 dB
                       1   0   1    2   3   4    5   6                   0.1
                            Voltage in units of standard deviation
               Figure C22 Rician distribution.
                                                                          0
                                                                            10  8  6  4  2  0  2  4  6  8  10
                                                                                       10 log s /s
                                                                                              m
                   2
                                                                    Figure C25 Log-normal distribution. Median value = s .
                                                                                                            m
                  1.8
                                                                The  clutter (spatial)  distribution describes the reflectivity
                  1.6                                           of clutter as a function of location, usually in range, azimuth,
                                        m = 6
                  1.4                                           and elevation radar coordinates. In range, it may be limited by
                         m = 0          m = 5                   the clutter horizon or (for surface clutter)  by the  interface
                Probability density  0.8  m = 3                 between land and sea. In azimuth it may depend on the hori-
                  1.2
                                        m = 4
                                                                zontal extent of a cloud or on the land-sea interface. In eleva-
                   1
                                                                tion (at a given range) it depends on the maximum height of
                                                                sary part of the clutter model. DKB
                  0.6                   m = 2                   the precipitation or chaff cloud. These parameters are a neces-
                                         m = 1
                  0.4                                           clutter equations (see RANGE EQUATION with clutter).
                                                                A clutter filter is a signal-processing element that is intended
                  0.2
                                                                to reject the frequency components of clutter while passing
                   0                                            target signals. Examples are the MTI canceler, the notch filter
                    0.5  0   0.5   1   1.5   2   2.5  3
                                                                in a range-gated MTI or  pulsed doppler processor, and the
                                Power/Mean Power
                                                                response envelope of the filter bank in which filters contain-
                                                                ing clutter have been omitted or desensitized. DKB
              Figure C23 Power of Rician distributed variable.
                                                                clutter fluctuations (see clutter spectrum).
                                                                Gaussian clutter (see clutter (amplitude) distribution).
   87   88   89   90   91   92   93   94   95   96   97