Page 93 - Radar Technology Encyclopedia
P. 93

clutter, homogeneous                                                                  clutter, land  83


           ground clutter (see land clutter).                       The average reflectivity observed by a radar at low graz-
                                                                                         , is dominated by the clutter
                                                                                   (
                                                                                   ¤
                                                                ing angle,  y < y =  l 4ps )
           Homogeneous clutter is distributed clutter for which  the          c        h
                                                                propagation factor F :
                                                                                c
           amplitude pdf is approximately Rayleigh with constant mean
                                                                                                     4
           value over many clutter cells of the observing radar. A thresh-  s F =  ( g sin  y) F » ( gy) y y)
                                                                                         4
                                                                            0 4
                                                                                               (
                                                                                                 ¤
                                                                              c
                                                                                                   c
                                                                                         c
           old set by a cell-averaging CFAR processor can control false
                                                                which is a strong function of frequency. The strong  depen-
           alarms from such clutter with minimal losses. DKB             4
                                                                dence of F   for a particular clutter cell on the heights of clut-
           Ref.: Nitzberg (1992), pp. 213–216.                           c
                                                                ter  sources  within  that cell causes a broad spread of
           The clutter horizon refers to the range beyond which clutter  amplitudes from cell to cell, typically described by a Weibull
           is masked by the earth’s surface. For surface clutter, the hori-  or log-normal distribution. Weibull spread parameters, a = 4
           zon range R  is set by the height h  of the radar antenna above  to 5, or log-normal standard deviations s  = 12 to 15 dB, are
                     h
                                      r
                                                                                                 y
           the surface:                                         normally observed in land clutter near the horizon (see clut-
                              R =   2kah                        ter (amplitude) distribution.)
                                h       r
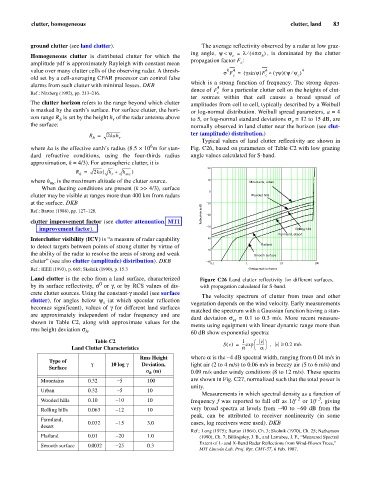
                                                                    Typical values of land clutter reflectivity are shown in
                                                   6
           where ka is the effective earth’s radius (8.5 ´ 10 m for stan-  Fig. C26, based on parameters of Table C2 with low grazing
           dard refractive conditions,  using  the  four-thirds  radius  angle values calculated for S-band.
           approximation, k = 4/3). For atmospheric clutter, it is
                                                                      20
                          R =   2ka(  h +  h  )
                           h          r    mc
           where h  is the maximum altitude of the clutter source.    10           Mountains, urban
                  mc
               When ducting conditions are present (k >> 4/3), surface
                                                                      0
           clutter may be visible at ranges more than 400 km from radars            Wooded hills
           at the surface. DKB                                        10
           Ref.: Barton (1988), pp. 127–128.                        Reflectivity in dB  20
           clutter improvement factor (see clutter attenuation, MTI
                                                                      30
              improvement factor).                                                                 Rolling hills
                                                                                             Farmland, desert
           Interclutter visibility (ICV) is “a measure of radar capability  40
           to detect targets between points of strong clutter by virtue of             Flatland
                                                                      50
           the ability of the radar to resolve the areas of strong and weak          Smooth surface
           clutter” (see also clutter (amplitude) distribution). DKB  60
                                                                      0.1         1           10         100
           Ref.: IEEE (1993), p. 665; Skolnik (1990), p. 15.3                      Grazing angle in degrees
           Land clutter is the echo from a land surface, characterized  Figure C26  Land clutter reflectivity for different  surfaces,
                                  0
           by its surface reflectivity, s  or g, or by RCS values of dis-  with propagation calculated for S-band.
           crete clutter sources. Using the constant-g model (see surface
                                                                    The velocity spectrum of clutter  from trees  and other
           clutter), for angles below  y  (at  which specular reflection  vegetation depends on the wind velocity. Early measurements
                                   s
           becomes significant), values of g for different land surfaces
                                                                matched the spectrum with a Gaussian function having a stan-
           are approximately  independent  of radar frequency and are
                                                                dard deviation  s   =  0.1 to 0.3 m/s. More recent measure-
                                                                              vt
           shown in  Table  C2, along  with approximate  values for  the
                                                                ments using equipment with linear dynamic range more than
           rms height deviation s .                             60 dB show exponential spectra:
                             h
                                Table C2                                         1   æ  v ö
                                                                           Sv () ---exp –=  -----      v ³,  0.2 m/s
                         Land Clutter Characteristics                            a   è  a ø
                                               Rms Height       where a is the -4 dB spectral width, ranging from 0.04 m/s in
                 Type of
                               g      10 log g  Deviation,      light air (2 to 4 m/s) to 0.06 m/s in breezy air (5 to 6 m/s) and
                 Surface
                                                 s  (m)         0.09 m/s under windy conditions (8 to 12 m/s). These spectra
                                                  h
              Mountains       0.32      -5        100           are shown in Fig. C27, normalized such that the total power is
                                                                unity.
              Urban           0.32      -5        10
                                                                    Measurements in which spectral density as a function of
                                                                                                   2
                                                                                                          3
              Wooded hills    0.10     -10        10            frequency f was reported to fall off as 1/f   or 1/f  , giving
              Rolling hills   0.063    -12        10            very  broad  spectra at levels from  -40 to  -60 dB from  the
                                                                peak,  can be  attributed to  receiver nonlinearity (in  some
              Farmland,
                              0.032    -15        3.0           cases, log receivers were used). DKB
              desert
                                                                Ref.: Long (1975); Barton (1964), Ch. 3; Skolnik (1970), Ch. 25; Nathanson
              Flatland        0.01     -20        1.0              (1990), Ch. 7; Billingsley, J. B., and Larrabee, J. F., “Measured Spectral
                                                                   Extent of L- and X-Band Radar Reflections from Wind-Blown Trees,”
              Smooth surface  0.0032   -25        0.3
                                                                   MIT Lincoln Lab. Proj. Rpt. CMT-57, 6 Feb. 1987.
   88   89   90   91   92   93   94   95   96   97   98