Page 103 - Rapid Learning in Robotics
P. 103

6.6 RLC-Circuit Example                                                                  89


                 Its amplitude is governed by the impedance Z of the circuit and there is a
                 phase shift  . Both depend on the frequency f and the components in the
                 circuit:

                                                       v


                                                       u
                                                       u

                                       f

                               Z   Z R L C             t R      
  f L                     (6.4)
                                                                         
  f C
                                                           
  f L
                                       f

                                      R L C            atan           fC                   (6.5)
                                                                 R
                     Following Friedman (1991), we varied the variables in the range:
                                                	   R
                                                	   L   	   [H]
                                                	   C   	       F

                                             
   	  f   	 
   [ Hz]

                 which results in a impedance range Z                      and the phase lag

                 between     .
                     The PSOM training sets are generated by active sampling (here com-
                 puting) the impedance Z and   for combination of one out of n resistors
                 values R, one (of n) capacitor values C, one (of n) inductor values L,at
                 n different frequencies f. As the embedding space we used the d
                 dimensional space X spanned by the variables x   R  L  C  f  Z     .

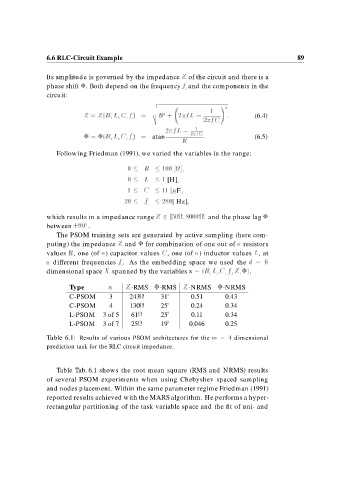
                         Type          n     Z-RMS      -RMS      Z-NRMS       -NRMS
                         C-PSOM        3       243        31        0.51        0.43
                         C-PSOM        4       130        25        0.24        0.34
                         L-PSOM      3 of 5    61         25        0.11        0.34
                         L-PSOM      3 of 7    25         19        0.046       0.25


                 Table 6.1: Results of various PSOM architectures for the m        dimensional
                 prediction task for the RLC circuit impedance.


                     Table Tab. 6.1 shows the root mean square (RMS and NRMS) results
                 of several PSOM experiments when using Chebyshev spaced sampling
                 and nodes placement. Within the same parameter regime Friedman (1991)
                 reported results achieved with the MARS algorithm. He performs a hyper-
                 rectangular partitioning of the task variable space and the fit of uni- and
   98   99   100   101   102   103   104   105   106   107   108