Page 152 - Rashid, Power Electronics Handbook
P. 152

10  Diode Recti®ers                                                                                 141

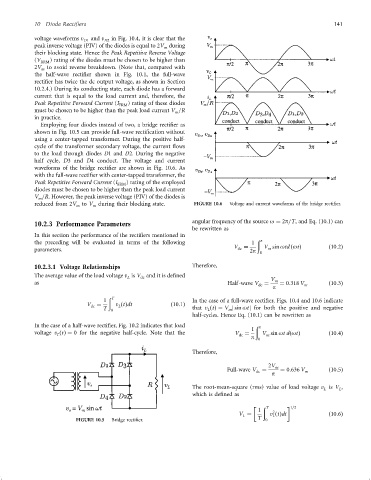
                 voltage waveforms v D1  and v D2  in Fig. 10.4, it is clear that the
                 peak inverse voltage (PIV) of the diodes is equal to 2V during
                                                             m
                 their blocking state. Hence the Peak Repetitive Reverse Voltage
                 (V RRM ) rating of the diodes must be chosen to be higher than
                 2V to avoid reverse breakdown. (Note that, compared with
                    m
                 the half-wave recti®er shown in Fig. 10.1, the full-wave
                 recti®er has twice the dc output voltage, as shown in Section
                 10.2.4.) During its conducting state, each diode has a forward
                 current that is equal to the load current and, therefore, the
                 Peak Repetitive Forward Current (I  ) rating of these diodes
                                              FRM
                 must be chosen to be higher than the peak load current V =R
                                                                m
                 in practice.
                   Employing four diodes instead of two, a bridge recti®er as
                 shown in Fig. 10.5 can provide full-wave recti®cation without
                 using a center-tapped transformer. During the positive half-
                 cycle of the transformer secondary voltage, the current ¯ows
                 to the load through diodes D1 and D2. During the negative
                 half cycle, D3 and D4 conduct. The voltage and current
                 waveforms of the bridge recti®er are shown in Fig. 10.6. As
                 with the full-wave recti®er with center-tapped transformer, the
                 Peak Repetitive Forward Current (I FRM ) rating of the employed
                 diodes must be chosen to be higher than the peak load current
                 V =R. However, the peak inverse voltage (PIV) of the diodes is
                   m
                 reduced from 2V to V during their blocking state.     FIGURE 10.6  Voltage and current waveforms of the bridge recti®er.
                                     m
                               m
                 10.2.3 Performance Parameters                        angular frequency of the source o ¼ 2p=T, and Eq. (10.1) can
                                                                      be rewritten as
                 In this section the performance of the recti®ers mentioned in
                 the preceding will be evaluated in terms of the following                1  ð p
                                                                                    V ¼       V sin otd ðotÞ       ð10:2Þ
                 parameters.                                                         dc  2p  0  m

                 10.2.3.1 Voltage Relationships                       Therefore,
                 The average value of the load voltage v is V and it is de®ned                  V
                                                L
                                                     dc
                 as                                                               Half-wave V ¼  m  ¼ 0:318 V m    ð10:3Þ
                                                                                            dc
                                                                                                 p
                                          ð T
                                         1                            In the case of a full-wave recti®er, Figs. 10.4 and 10.6 indicate
                                   V ¼       v ðtÞdt           ð10:1Þ
                                    dc
                                             L
                                        T  0                          that v ðtÞ¼ V j sin otj for both the positive and negative
                                                                           L
                                                                                  m
                                                                      half-cycles. Hence Eq. (10.1) can be rewritten as
                 In the case of a half-wave recti®er, Fig. 10.2 indicates that load        ð p
                                                                                          1
                 voltage v ðtÞ¼ 0 for the negative half-cycle. Note that the        V ¼      V sin otdðotÞ         ð10:4Þ
                         L
                                                                                      dc
                                                                                               m
                                                                                          p  0
                                                                      Therefore,
                                                                                               2V m
                                                                                  Full-wave V ¼    ¼ 0:636 V       ð10:5Þ
                                                                                           dc    p         m
                                                                      The root-mean-square (rms) value of load voltage v is V ,
                                                                                                                  L    L
                                                                      which is de®ned as
                                                                                             ð T        1=2
                                                                                            1    2
                                                                                      V ¼       v ðtÞdt            ð10:6Þ
                                                                                                 L
                                                                                       L
                               FIGURE 10.5  Bridge recti®er.                                T  0
   147   148   149   150   151   152   153   154   155   156   157