
Page 150 - Renewable Energy Devices and System with Simulations in MATLAB and ANSYS
P. 150
Design of Residential Photovoltaic Systems 137
99
97
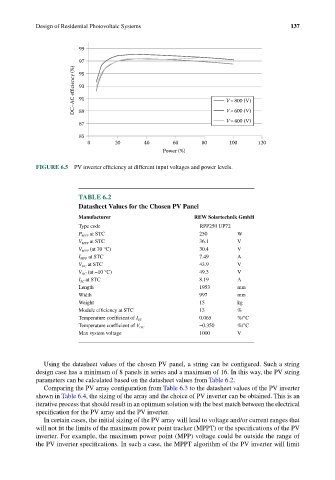
DC−AC efficiency (%) 93 V=800 (V)
95
91
89
V=400 (V)
87 V=600 (V)
85
0 20 40 60 80 100 120
Power (%)
FIGURE 6.5 PV inverter efficiency at different input voltages and power levels.
TABLE 6.2
Datasheet Values for the Chosen PV Panel
Manufacturer REW Solartechnik GmbH
Type code RPP250 UP72
P MPP at STC 250 W
V MPP at STC 36.1 V
V MPP (at 70 °C) 30.4 V
I MPP at STC 7.49 A
V OC at STC 43.9 V
V OC (at −10 °C) 49.3 V
I SC at STC 8.19 A
Length 1953 mm
Width 997 mm
Weight 15 kg
Module efficiency at STC 13 %
0.065 %/°C
Temperature coefficient of I SC
−0.350 %/°C
Temperature coefficient of V OC
Max system voltage 1000 V
Using the datasheet values of the chosen PV panel, a string can be configured. Such a string
design case has a minimum of 8 panels in series and a maximum of 16. In this way, the PV string
parameters can be calculated based on the datasheet values from Table 6.2.
Comparing the PV array configuration from Table 6.3 to the datasheet values of the PV inverter
shown in Table 6.4, the sizing of the array and the choice of PV inverter can be obtained. This is an
iterative process that should result in an optimum solution with the best match between the electrical
specification for the PV array and the PV inverter.
In certain cases, the initial sizing of the PV array will lead to voltage and/or current ranges that
will not fit the limits of the maximum power point tracker (MPPT) or the specifications of the PV
inverter. For example, the maximum power point (MPP) voltage could be outside the range of
the PV inverter specifications. In such a case, the MPPT algorithm of the PV inverter will limit