
Page 151 - Renewable Energy Devices and System with Simulations in MATLAB and ANSYS
P. 151
138 Renewable Energy Devices and Systems with Simulations in MATLAB and ANSYS ®
®
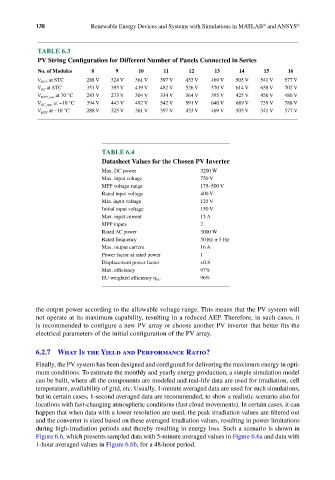
TABLE 6.3
PV String Configuration for Different Number of Panels Connected in Series
No. of Modules 8 9 10 11 12 13 14 15 16
V MPP at STC 288 V 324 V 361 V 397 V 433 V 469 V 505 V 541 V 577 V
V OC at STC 351 V 395 V 439 V 482 V 526 V 570 V 614 V 658 V 702 V
V MPP_min at 70 °C 243 V 273 V 304 V 334 V 364 V 395 V 425 V 456 V 486 V
V OC_max at −10 °C 394 V 443 V 492 V 542 V 591 V 640 V 689 V 739 V 788 V
V MPP at −10 °C 288 V 325 V 361 V 397 V 433 V 469 V 505 V 541 V 577 V
TABLE 6.4
Datasheet Values for the Chosen PV Inverter
Max. DC power 3200 W
Max. input voltage 750 V
MPP voltage range 175–500 V
Rated input voltage 400 V
Min. input voltage 125 V
Initial input voltage 150 V
Max. input current 15 A
MPP inputs 2
Rated AC power 3000 W
Rated frequency 50 Hz ± 5 Hz
Max. output current 16 A
Power factor at rated power 1
Displacement power factor ±0.8
Max. efficiency 97%
96%
EU weighted efficiency η EU
the output power according to the allowable voltage range. This means that the PV system will
not operate at its maximum capability, resulting in a reduced AEP. Therefore, in such cases, it
is recommended to configure a new PV array or choose another PV inverter that better fits the
electrical parameters of the initial configuration of the PV array.
6.2.7 What Is the Yield and Performance Ratio?
Finally, the PV system has been designed and configured for delivering the maximum energy in opti-
mum conditions. To estimate the monthly and yearly energy production, a simple simulation model
can be built, where all the components are modeled and real-life data are used for irradiation, cell
temperature, availability of grid, etc. Usually, 1-minute averaged data are used for such simulations,
but in certain cases, 1-second averaged data are recommended, to show a realistic scenario also for
locations with fast-changing atmospheric conditions (fast cloud movements). In certain cases, it can
happen that when data with a lower resolution are used, the peak irradiation values are filtered out
and the converter is sized based on these averaged irradiation values, resulting in power limitations
during high-irradiation periods and thereby resulting in energy loss. Such a scenario is shown in
Figure 6.6, which presents sampled data with 5-minute averaged values in Figure 6.6a and data with
1-hour averaged values in Figure 6.6b, for a 48-hour period.