
Page 152 - Renewable Energy Devices and System with Simulations in MATLAB and ANSYS
P. 152
Design of Residential Photovoltaic Systems 139
2
5-minute averaged solar insolation (W/m )
1200
1000
800
600
400
200
0
1:05 AM/ 1 3:05 AM/ 1 5:05 AM/ 1 7:05 AM/ 1 9:05 AM/ 1 11:05 AM/ 1 1:05 PM/ 1 3:05 PM/ 1 5:05 PM/ 1 7:05 PM/ 1 9:05 PM/ 1 11:05 PM/ 1 1:05 AM/ 2 3:05 AM/ 2 5:05 AM/ 2 7:05 AM/ 2 9:05 AM/ 2 11:05 AM/ 2 1:05 PM/ 2 3:05 PM/ 2 5:05 PM/ 2 7:05 PM/ 2 9:05 PM/ 2 11:05 PM/ 2
(a)
2
1-hour averaged solar insolation (W/m )
1200
1000
800
600
400
200
0
2:00 AM/ 1 4:00 AM/ 1 6:00 AM/ 1 8:00 AM/ 1 10:00 AM/ 1 12:00 PM/ 1 2:00 PM/ 1 4:00 PM/ 1 6:00 PM/ 1 8:00 PM/ 1 10:00 PM/ 1 12:00 AM/ 2 2:00 AM/ 2 4:00 AM/ 2 6:00 AM/ 2 8:00 AM/ 2 10:00 AM/ 2 12:00 PM/ 2 2:00 PM/ 2 4:00 PM/ 2 6:00 PM/ 2 8:00 PM/ 2 10:00 PM/ 2 12:00 AM/ 3
(b)
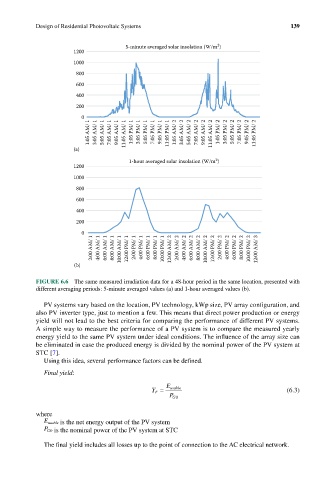
FIGURE 6.6 The same measured irradiation data for a 48-hour period in the same location, presented with
different averaging periods: 5-minute averaged values (a) and 1-hour averaged values (b).
PV systems vary based on the location, PV technology, kWp size, PV array configuration, and
also PV inverter type, just to mention a few. This means that direct power production or energy
yield will not lead to the best criteria for comparing the performance of different PV systems.
A simple way to measure the performance of a PV system is to compare the measured yearly
energy yield to the same PV system under ideal conditions. The influence of the array size can
be eliminated in case the produced energy is divided by the nominal power of the PV system at
STC [7].
Using this idea, several performance factors can be defined.
Final yield:
Y F = E usable (6.3)
P G0
where
E usable is the net energy output of the PV system
P G0 is the nominal power of the PV system at STC
The final yield includes all losses up to the point of connection to the AC electrical network.