
Page 195 - Renewable Energy Devices and System with Simulations in MATLAB and ANSYS
P. 195
182 Renewable Energy Devices and Systems with Simulations in MATLAB and ANSYS ®
®
0.12
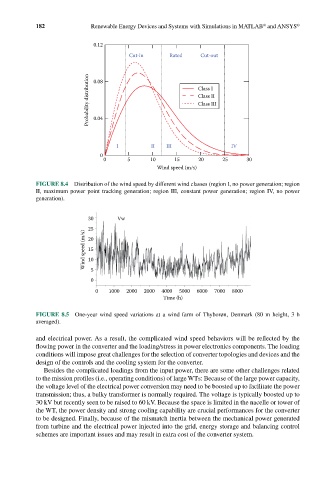
Cut-in Rated Cut-out
Probability distribution 0.08 Class I
Class II
Class III
0.04
I II III IV
0
0 5 10 15 20 25 30
Wind speed (m/s)
FIGURE 8.4 Distribution of the wind speed by different wind classes (region I, no power generation; region
II, maximum power point tracking generation; region III, constant power generation; region IV, no power
generation).
30 Vw
25
Wind speed (m/s) 15
20
10
0 5
0 1000 2000 2000 4000 5000 6000 7000 8000
Time (h)
FIGURE 8.5 One-year wind speed variations at a wind farm of Thyborøn, Denmark (80 m height, 3 h
averaged).
and electrical power. As a result, the complicated wind speed behaviors will be reflected by the
flowing power in the converter and the loading/stress in power electronics components. The loading
conditions will impose great challenges for the selection of converter topologies and devices and the
design of the controls and the cooling system for the converter.
Besides the complicated loadings from the input power, there are some other challenges related
to the mission profiles (i.e., operating conditions) of large WTs: Because of the large power capacity,
the voltage level of the electrical power conversion may need to be boosted up to facilitate the power
transmission; thus, a bulky transformer is normally required. The voltage is typically boosted up to
30 kV but recently seen to be raised to 60 kV. Because the space is limited in the nacelle or tower of
the WT, the power density and strong cooling capability are crucial performances for the converter
to be designed. Finally, because of the mismatch inertia between the mechanical power generated
from turbine and the electrical power injected into the grid, energy storage and balancing control
schemes are important issues and may result in extra cost of the converter system.