
Page 36 - Renewable Energy Devices and System with Simulations in MATLAB and ANSYS
P. 36
Solar Power Sources: PV, Concentrated PV, and Concentrated Solar Power 23
where
I is the nominal short-circuit current
scn
K is the current temperature coefficient
i
T is the nominal cell temperature
n
V is the nominal open-circuit voltage
ocn
K is the voltage temperature coefficient
v
a is the diode ideality factor
V is the thermal voltage
t
Note that the diode voltage V is the same as the PV voltage V for the ideal model. Also, the
d
pv
thermal voltage V depends on temperature T and is defined by
t
kT
V T () = N s (2.4)
t
q
where
−23
k is Boltzmann’s constant (approximately 1.3807 × 10 J·K )
−1
q is the electron charge (1.60217662 × 10 C)
−19
N is the number of PV cells in series
s
Using Kirchhoff’s circuit laws, the relation between the PV current I and PV voltage V for the
pv
pv
ideal PV model is
G T) − ( ,
I pv = I ph ( , I TV pv) (2.5)
d
where the photocurrent I is defined in (2.1) and the diode current I is defined in (2.2). Based on
ph
d
the PV current I equation, given in (2.5), it is clear that the PV output current is related to the solar
pv
irradiance G and temperature T.
Given the solar irradiance and temperature, this explicit equation in (2.5) can be used to deter-
mine the PV current for a given voltage. These equations can also be rearranged using basic algebra
to determine the PV voltage based on a given current. The simple PV model can be implemented
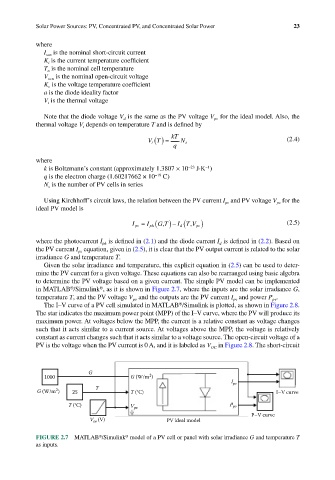
in MATLAB /Simulink , as it is shown in Figure 2.7, where the inputs are the solar irradiance G,
®
®
temperature T, and the PV voltage V and the outputs are the PV current I and power P .
pv
pv
pv
The I–V curve of a PV cell simulated in MATLAB /Simulink is plotted, as shown in Figure 2.8.
®
The star indicates the maximum power point (MPP) of the I–V curve, where the PV will produce its
maximum power. At voltages below the MPP, the current is a relative constant as voltage changes
such that it acts similar to a current source. At voltages above the MPP, the voltage is relatively
constant as current changes such that it acts similar to a voltage source. The open-circuit voltage of a
PV is the voltage when the PV current is 0 A, and it is labeled as V in Figure 2.8. The short-circuit
OC
G
2
1000 G (W/m )
I pv
2
G (W/m ) 25 T T (°C) I–V curve
T (°C) V pv P pv
P–V curve
V (V) PV ideal model
in
FIGURE 2.7 MATLAB /Simulink model of a PV cell or panel with solar irradiance G and temperature T
®
®
as inputs.