
Page 37 - Renewable Energy Devices and System with Simulations in MATLAB and ANSYS
P. 37
24 Renewable Energy Devices and Systems with Simulations in MATLAB and ANSYS ®
®
5
4 MPP
I SC
PV current (A) 3 2
1
V OC
0
0 0.1 0.2 0.3 0.4 0.5 0.6 0.7
PV voltage (V)
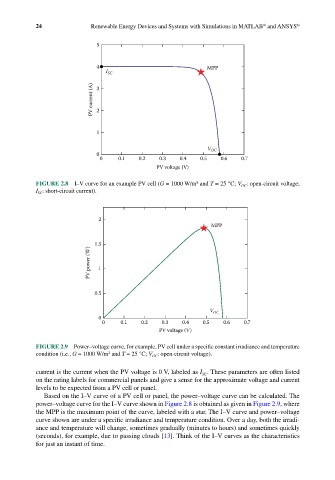
FIGURE 2.8 I–V curve for an example PV cell (G = 1000 W/m² and T = 25 °C; V OC : open-circuit voltage;
I SC : short-circuit current).
2
MPP
1.5
PV power (W) 1
0.5
V OC
0
0 0.1 0.2 0.3 0.4 0.5 0.6 0.7
PV voltage (V)
FIGURE 2.9 Power–voltage curve, for example, PV cell under a specific constant irradiance and temperature
2
condition (i.e., G = 1000 W/m and T = 25 °C; V OC : open-circuit voltage).
current is the current when the PV voltage is 0 V, labeled as I . These parameters are often listed
SC
on the rating labels for commercial panels and give a sense for the approximate voltage and current
levels to be expected from a PV cell or panel.
Based on the I–V curve of a PV cell or panel, the power–voltage curve can be calculated. The
power–voltage curve for the I–V curve shown in Figure 2.8 is obtained as given in Figure 2.9, where
the MPP is the maximum point of the curve, labeled with a star. The I–V curve and power–voltage
curve shown are under a specific irradiance and temperature condition. Over a day, both the irradi-
ance and temperature will change, sometimes gradually (minutes to hours) and sometimes quickly
(seconds), for example, due to passing clouds [13]. Think of the I–V curves as the characteristics
for just an instant of time.