
Page 107 - Reservoir Geomechanics
P. 107
91 Rock failure in compression, tension and shear
2.9
40 m 2.0
Cohesive strength S 0 (MPa) 20 1.5
30
1.0
10
0 0.5
0
lithic tuff andesites basalts granitic rocks graywackes limestone conglomerates mudstones sandstones phyllites schists hornfels gneiss lithic tuff andesites basalts granitic rocks graywackes limestone conglomerates mudstones sandstones phyllites schists hornfels gneiss
Igneous Sedimentary Metamorphic Igneous Sedimentary Metamorphic
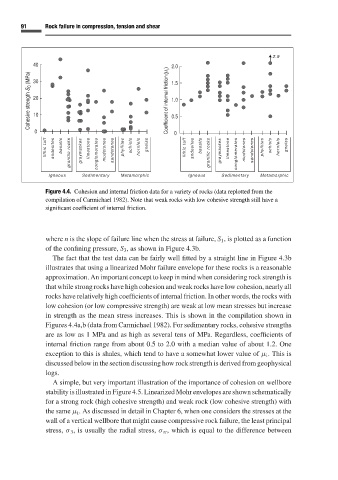
Figure 4.4. Cohesion and internal friction data for a variety of rocks (data replotted from the
compilation of Carmichael 1982). Note that weak rocks with low cohesive strength still have a
significant coefficient of internal friction.
where n is the slope of failure line when the stress at failure, S 1 ,is plotted as a function
of the confining pressure, S 3 ,as shown in Figure 4.3b.
The fact that the test data can be fairly well fitted by a straight line in Figure 4.3b
illustrates that using a linearized Mohr failure envelope for these rocks is a reasonable
approximation. An important concept to keep in mind when considering rock strength is
that while strong rocks have high cohesion and weak rocks have low cohesion, nearly all
rocks have relatively high coefficients of internal friction. In other words, the rocks with
low cohesion (or low compressive strength) are weak at low mean stresses but increase
in strength as the mean stress increases. This is shown in the compilation shown in
Figures 4.4a,b (data from Carmichael 1982). For sedimentary rocks, cohesive strengths
are as low as 1 MPa and as high as several tens of MPa. Regardless, coefficients of
internal friction range from about 0.5 to 2.0 with a median value of about 1.2. One
exception to this is shales, which tend to have a somewhat lower value of µ i . This is
discussed below in the section discussing how rock strength is derived from geophysical
logs.
A simple, but very important illustration of the importance of cohesion on wellbore
stability is illustrated in Figure 4.5. Linearized Mohr envelopes are shown schematically
for a strong rock (high cohesive strength) and weak rock (low cohesive strength) with
the same µ i .As discussed in detail in Chapter 6, when one considers the stresses at the
wall of a vertical wellbore that might cause compressive rock failure, the least principal
stress, σ 3 ,is usually the radial stress, σ rr , which is equal to the difference between