
Page 133 - Reservoir Geomechanics
P. 133
116 Reservoir geomechanics
Table 4.4. Empirical relationships between and other logged measurements. After
Chang, Zoback et al.(2006). Reprinted with permission of Elsevier
degree General comments Reference
−1
27 sin ((V p −1000) / (V p +1000)) Applicable to shale (Lal 1999)
28 70 − 0.417GR Applicable to shaly sedimentary rocks Unpublished
with 60 < GR < 120
Units used: V p (m/s), GR (API)
UCS (psi) UCS (psi) UCS (psi) m i
8000
a. b. c. d.
8200
8400
8600
TVD below mud line (feet) 9000
8800
9200
9400
9600
9800
10000
0 1000 2000 0 1000 2000 0 1000 2000 0 0.5 1
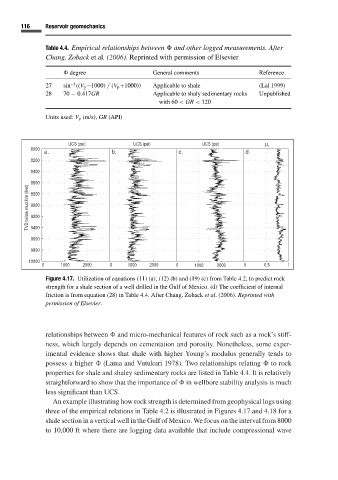
Figure 4.17. Utilization of equations (11) (a), (12) (b) and (19) (c) from Table 4.2,to predict rock
strength for a shale section of a well drilled in the Gulf of Mexico. (d) The coefficient of internal
friction is from equation (28) in Table 4.4. After Chang, Zoback et al.(2006). Reprinted with
permission of Elsevier.
relationships between and micro-mechanical features of rock such as a rock’s stiff-
ness, which largely depends on cementation and porosity. Nonetheless, some exper-
imental evidence shows that shale with higher Young’s modulus generally tends to
possess a higher (Lama and Vutukuri 1978). Two relationships relating to rock
properties for shale and shaley sedimentary rocks are listed in Table 4.4.Itis relatively
straightforward to show that the importance of in wellbore stability analysis is much
less significant than UCS.
An example illustrating how rock strength is determined from geophysical logs using
three of the empirical relations in Table 4.2 is illustrated in Figures 4.17 and 4.18 for a
shale section in a vertical well in the Gulf of Mexico. We focus on the interval from 8000
to 10,000 ft where there are logging data available that include compressional wave