
Page 137 - Reservoir Geomechanics
P. 137
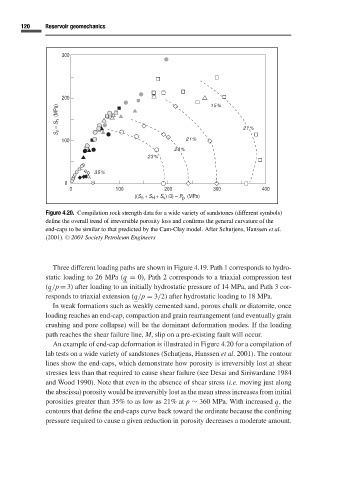
120    Reservoir geomechanics


                   300


                   200                                        15%
                  S v  − S h   (MPa)                                    21%


                   100                                 21%
                                                    20%
                                            23%

                            35%
                    0
                     0             100           200           300           400
                                        ((S  + S  + S ) /3) − P   (MPa)
                                                      p
                                                 v
                                          h
                                             H
              Figure 4.20. Compilation rock strength data for a wide variety of sandstones (different symbols)
              define the overall trend of irreversible porosity loss and confirms the general curvature of the
              end-caps to be similar to that predicted by the Cam-Clay model. After Schutjens, Hanssen et al.
              (2001). C  2001 Society Petroleum Engineers


                Three different loading paths are shown in Figure 4.19.Path 1 corresponds to hydro-
              static loading to 26 MPa (q = 0), Path 2 corresponds to a triaxial compression test
              (q/p = 3) after loading to an initially hydrostatic pressure of 14 MPa, and Path 3 cor-
              responds to triaxial extension (q/p = 3/2) after hydrostatic loading to 18 MPa.
                In weak formations such as weakly cemented sand, porous chalk or diatomite, once
              loading reaches an end-cap, compaction and grain rearrangement (and eventually grain
              crushing and pore collapse) will be the dominant deformation modes. If the loading
              path reaches the shear failure line, M, slip on a pre-existing fault will occur.
                An example of end-cap deformation is illustrated in Figure 4.20 for a compilation of
              lab tests on a wide variety of sandstones (Schutjens, Hanssen et al. 2001). The contour
              lines show the end-caps, which demonstrate how porosity is irreversibly lost at shear
              stresses less than that required to cause shear failure (see Desai and Siriwardane 1984
              and Wood 1990). Note that even in the absence of shear stress (i.e. moving just along
              the abscissa) porosity would be irreversibly lost as the mean stress increases from initial
              porosities greater than 35% to as low as 21% at p ∼ 360 MPa. With increased q, the
              contours that define the end-caps curve back toward the ordinate because the confining
              pressure required to cause a given reduction in porosity decreases a moderate amount.