
Page 136 - Reservoir Geomechanics
P. 136
119 Rock failure in compression, tension and shear
40
SHEAR FAILURE 2 TRIAXIAL COMPRESSION
35 M 1 HYDROSTATIC TEST
30 3 TRIAXIAL EXTENSION
25
q (MPa) 20 END CAP
COMPACTION
15
30%
10
34%
5 3 37%
2
1 39%
0
0 10 20 30 40 50 60 70
p (MPa)
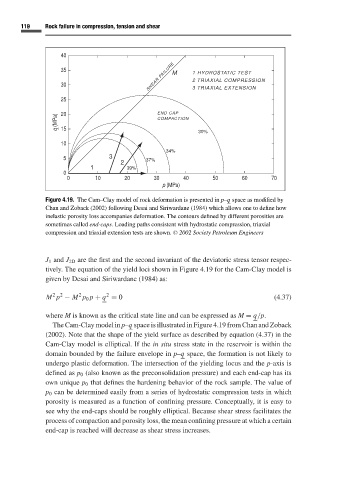
Figure 4.19. The Cam–Clay model of rock deformation is presented in p–q space as modified by
Chan and Zoback (2002) following Desai and Siriwardane (1984) which allows one to define how
inelastic porosity loss accompanies deformation. The contours defined by different porosities are
sometimes called end-caps. Loading paths consistent with hydrostatic compression, triaxial
compression and triaxial extension tests are shown. C 2002 Society Petroleum Engineers
J 1 and J 2D are the first and the second invariant of the deviatoric stress tensor respec-
tively. The equation of the yield loci shown in Figure 4.19 for the Cam-Clay model is
given by Desai and Siriwardane (1984) as:
2
2
2 2
M p − M p 0 p + q = 0 (4.37)
where M is known as the critical state line and can be expressed as M = q/p.
The Cam-Clay model in p–q space is illustrated in Figure 4.19 from Chan and Zoback
(2002). Note that the shape of the yield surface as described by equation (4.37)in the
Cam-Clay model is elliptical. If the in situ stress state in the reservoir is within the
domain bounded by the failure envelope in p–q space, the formation is not likely to
undergo plastic deformation. The intersection of the yielding locus and the p-axis is
defined as p 0 (also known as the preconsolidation pressure) and each end-cap has its
own unique p 0 that defines the hardening behavior of the rock sample. The value of
p 0 can be determined easily from a series of hydrostatic compression tests in which
porosity is measured as a function of confining pressure. Conceptually, it is easy to
see why the end-caps should be roughly elliptical. Because shear stress facilitates the
process of compaction and porosity loss, the mean confining pressure at which a certain
end-cap is reached will decrease as shear stress increases.