
Page 131 - Reservoir Geomechanics
P. 131
114 Reservoir geomechanics
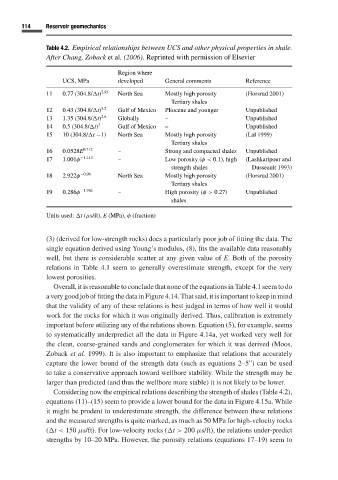
Table 4.2. Empirical relationships between UCS and other physical properties in shale.
After Chang, Zoback et al.(2006). Reprinted with permission of Elsevier
Region where
UCS, MPa developed General comments Reference
11 0.77 (304.8/
t) 2.93 North Sea Mostly high porosity (Horsrud 2001)
Tertiary shales
12 0.43 (304.8/
t) 3.2 Gulf of Mexico Pliocene and younger Unpublished
13 1.35 (304.8/
t) 2.6 Globally – Unpublished
14 0.5 (304.8/
t) 3 Gulf of Mexico – Unpublished
15 10 (304.8/
t −1) North Sea Mostly high porosity (Lal 1999)
Tertiary shales
16 0.0528E 0.712 – Strong and compacted shales Unpublished
17 1.001φ −1.143 – Low porosity (φ< 0.1), high (Lashkaripour and
strength shales Dusseault 1993)
18 2.922φ −0.96 North Sea Mostly high porosity (Horsrud 2001)
Tertiary shales
19 0.286φ −1.762 – High porosity (φ> 0.27) Unpublished
shales
Units used:
t (µs/ft), E (MPa), φ (fraction)
(3) (derived for low-strength rocks) does a particularly poor job of fitting the data. The
single equation derived using Young’s modulus, (8), fits the available data reasonably
well, but there is considerable scatter at any given value of E. Both of the porosity
relations in Table 4.1 seem to generally overestimate strength, except for the very
lowest porosities.
Overall, it is reasonable to conclude that none of the equations in Table 4.1 seem to do
avery good job of fitting the data in Figure 4.14. That said, it is important to keep in mind
that the validity of any of these relations is best judged in terms of how well it would
work for the rocks for which it was originally derived. Thus, calibration is extremely
important before utilizing any of the relations shown. Equation (5), for example, seems
to systematically underpredict all the data in Figure 4.14a, yet worked very well for
the clean, coarse-grained sands and conglomerates for which it was derived (Moos,
Zoback et al. 1999). It is also important to emphasize that relations that accurately
capture the lower bound of the strength data (such as equations 2–5”) can be used
to take a conservative approach toward wellbore stability. While the strength may be
larger than predicted (and thus the wellbore more stable) it is not likely to be lower.
Considering now the empirical relations describing the strength of shales (Table 4.2),
equations (11)–(15) seem to provide a lower bound for the data in Figure 4.15a. While
it might be prudent to underestimate strength, the difference between these relations
and the measured strengths is quite marked, as much as 50 MPa for high-velocity rocks
(
t < 150 µs/ft). For low-velocity rocks (
t > 200 µs/ft), the relations under-predict
strengths by 10–20 MPa. However, the porosity relations (equations 17–19) seem to