
Page 132 - Reservoir Geomechanics
P. 132
115 Rock failure in compression, tension and shear
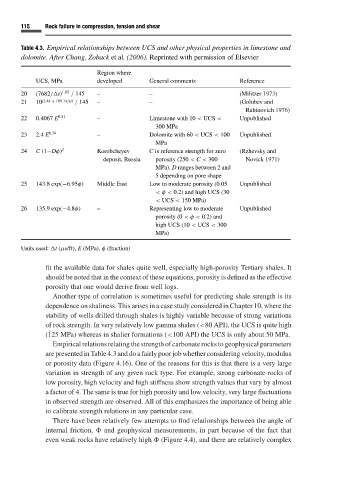
Table 4.3. Empirical relationships between UCS and other physical properties in limestone and
dolomite. After Chang, Zoback et al.(2006). Reprinted with permission of Elsevier
Region where
UCS, MPa developed General comments Reference
20 (7682/
t) 1.82 / 145 – – (Militzer 1973)
21 10 (2.44 + 109.14/(t) / 145 – – (Golubev and
Rabinovich 1976)
22 0.4067 E 0.51 – Limestone with 10 < UCS < Unpublished
300 MPa
23 2.4 E 0.34 – Dolomite with 60 < UCS < 100 Unpublished
MPa
24 C (1−Dφ) 2 Korobcheyev Cis reference strength for zero (Rzhevsky and
deposit, Russia porosity (250 < C < 300 Novick 1971)
MPa). D ranges between 2 and
5 depending on pore shape
25 143.8 exp(−6.95φ) Middle East Low to moderate porosity (0.05 Unpublished
<φ < 0.2) and high UCS (30
< UCS < 150 MPa)
26 135.9 exp(−4.8φ) – Representing low to moderate Unpublished
porosity (0 <φ < 0.2) and
high UCS (10 < UCS < 300
MPa)
Units used:
t (µs/ft), E (MPa), φ (fraction)
fit the available data for shales quite well, especially high-porosity Tertiary shales. It
should be noted that in the context of these equations, porosity is defined as the effective
porosity that one would derive from well logs.
Another type of correlation is sometimes useful for predicting shale strength is its
dependence on shaliness. This arises in a case study considered in Chapter 10, where the
stability of wells drilled through shales is highly variable because of strong variations
of rock strength. In very relatively low gamma shales (<80 API), the UCS is quite high
˜
(125 MPa) whereas in shalier formations (<100 API) the UCS is only about 50 MPa.
Empirical relations relating the strength of carbonate rocks to geophysical parameters
are presented in Table 4.3 and do a fairly poor job whether considering velocity, modulus
or porosity data (Figure 4.16). One of the reasons for this is that there is a very large
variation in strength of any given rock type. For example, strong carbonate rocks of
low porosity, high velocity and high stiffness show strength values that vary by almost
afactor of 4. The same is true for high porosity and low velocity, very large fluctuations
in observed strength are observed. All of this emphasizes the importance of being able
to calibrate strength relations in any particular case.
There have been relatively few attempts to find relationships between the angle of
internal friction, and geophysical measurements, in part because of the fact that
even weak rocks have relatively high (Figure 4.4), and there are relatively complex