
Page 71 - Semiconductor Manufacturing Handbook
P. 71
Geng(SMH)_CH06.qxd 04/04/2005 19:37 Page 6.10
PLASMA PROCESS CONTROL
6.10 SEMICONDUCTOR FUNDAMENTALS AND BASIC MATERIALS
frequency tuning generator controls the trajectory of the imaginary component of the impedance. To
ensure that auto frequency tuning generators do not interfere with emergency safety, search, and
rescue radio transmissions, the following frequency bands are blocked—490 to 510 kHz, 2170 to
2194 kHz, and 8354 to 8374 kHz.
6.3.1 Improvements in RF Control of Plasma
The RF configuration has seen some recent modifications that have ameliorated semiconductor pro-
cessing conditions and manufacturing yields. The objective of both approaches was to improve the
plasma density and ion energy. The changes include the use of multiple RF frequency sources and
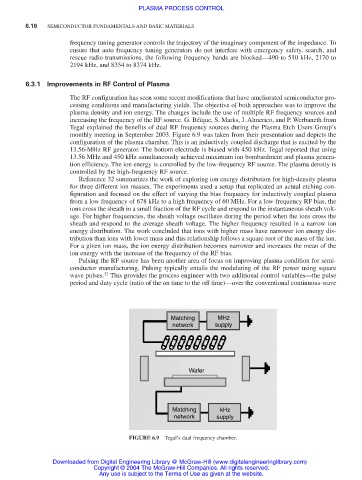
increasing the frequency of the RF source. G. Béïque, S. Marks, J. Almerico, and P. Werbaneth from
Tegal explained the benefits of dual RF frequency sources during the Plasma Etch Users Group’s
monthly meeting in September 2003. Figure 6.9 was taken from their presentation and depicts the
configuration of the plasma chamber. This is an inductively coupled discharge that is excited by the
13.56-MHz RF generator. The bottom electrode is biased with 450 kHz. Tegal reported that using
13.56 MHz and 450 kHz simultaneously achieved maximum ion bombardment and plasma genera-
tion efficiency. The ion energy is controlled by the low-frequency RF source. The plasma density is
controlled by the high-frequency RF source.
Reference 32 summarizes the work of exploring ion energy distribution for high-density plasma
for three different ion masses. The experiments used a setup that replicated an actual etching con-
figuration and focused on the effect of varying the bias frequency for inductively coupled plasma
from a low frequency of 678 kHz to a high frequency of 60 MHz. For a low-frequency RF bias, the
ions cross the sheath in a small fraction of the RF cycle and respond to the instantaneous sheath volt-
age. For higher frequencies, the sheath voltage oscillates during the period when the ions cross the
sheath and respond to the average sheath voltage. The higher frequency resulted in a narrow ion
energy distribution. The work concluded that ions with higher mass have narrower ion energy dis-
tribution than ions with lower mass and this relationship follows a square root of the mass of the ion.
For a given ion mass, the ion energy distribution becomes narrower and increases the mean of the
ion energy with the increase of the frequency of the RF bias.
Pulsing the RF source has been another area of focus on improving plasma condition for semi-
conductor manufacturing. Pulsing typically entails the modulating of the RF power using square
33
wave pulses. This provides the process engineer with two additional control variables—the pulse
period and duty cycle (ratio of the on time to the off time)—over the conventional continuous-wave
Matching MHz
network supply
Wafer
Matching kHz
network supply
FIGURE 6.9 Tegal’s dual frequency chamber.
Downloaded from Digital Engineering Library @ McGraw-Hill (www.digitalengineeringlibrary.com)
Copyright © 2004 The McGraw-Hill Companies. All rights reserved.
Any use is subject to the Terms of Use as given at the website.