
Page 68 - Semiconductor Manufacturing Handbook
P. 68
Geng(SMH)_CH06.qxd 04/04/2005 19:37 Page 6.7
PLASMA PROCESS CONTROL
PLASMA PROCESS CONTROL 6.7
The magnetic field components that are generated in this configuration yield the following advanta-
geous effects—the electron losses are reduced and the plasma density increased; and metal ions are
extracted from the source and their trajectories are guided toward the target.
Similarly in Ref. 25, a magnetron that uses a coaxial electromagnetic coil to create a magnetic
field component from the target to the wafer is described. This magnet assembly rotates around the
chamber axis. The magnetron was improved in Ref. 26 with the addition of auxiliary magnets that were
added to the outer periphery of the chamber. The auxiliary magnets—permanent or electromagnets—
proved to draw a portion of the unbalanced magnetic field toward the wafer. This design guided more
of the ionized sputter particles.
Reference 27 discloses a recent magnetron design for an inductively coupled source from Tokyo
Electron Limited. i The use of a stationary, axially symmetric permanent magnet assembly is described.
This magnetron design was found to enhance the concentration of a high-density inductively cou-
pled plasma by containing the plasma.
6.2.5 Inductively Coupled Plasma Versus Capacitively Coupled Plasma
Reference 8 provides the following delineation between an inductively coupled discharge and a
capacitively coupled discharge. The density of a capacitively coupled discharge is controlled by the
amount of RF current that can pass through the sheath. It has been shown that when the plasma
sheath impedance dominates, the plasma density is proportional to the square root of the plasma
17
power for electropositive gases. In conclusion, the plasma efficiency decreases as the power and
the sheath voltage increase. It is for this reason that an inductively coupled discharge has an advan-
tage over capacitively coupled discharges. An inductively coupled discharge tends to be more effi-
cient because the plasma discharge can be generated and controlled in the proximity of its use.
6.3 PROCESS CONTROL AND METROLOGY
Based on the derivations for inductively and capacitively coupled sources, it becomes evident that
the control of the RF source is a principal control point of the plasma source. The significant phys-
ical component of the discharge is the delivery of RF power into the plasma. For the inductively
coupled source, the power absorbed by the plasma was through the induced RF current. Conversely,
the power absorbed by the capacitively coupled discharge was through the induced RF voltage. It
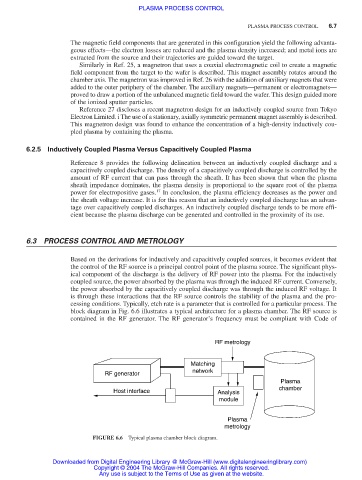
is through these interactions that the RF source controls the stability of the plasma and the pro-
cessing conditions. Typically, etch rate is a parameter that is controlled for a particular process. The
block diagram in Fig. 6.6 illustrates a typical architecture for a plasma chamber. The RF source is
contained in the RF generator. The RF generator’s frequency must be compliant with Code of
RF metrology
Matching
network
RF generator
Plasma
Host interface Analysis chamber
module
Plasma
metrology
FIGURE 6.6 Typical plasma chamber block diagram.
Downloaded from Digital Engineering Library @ McGraw-Hill (www.digitalengineeringlibrary.com)
Copyright © 2004 The McGraw-Hill Companies. All rights reserved.
Any use is subject to the Terms of Use as given at the website.