Page 74 - Semiconductor Manufacturing Handbook
P. 74

Geng(SMH)_CH06.qxd  04/04/2005  19:37  Page 6.13


                                                     PLASMA PROCESS CONTROL

                                                                                 PLASMA PROCESS CONTROL  6.13


                                                    Before                            After


                                               Plasma                             Plasma
                                      Plasma                       C     Plasma                     C
                                      sheath                        p     sheath                     p
                                               Resist Oxide        C o           Resist
                                               Silicon                            Silicon
                                                         Probe                            Probe


                                      FIGURE 6.12  Oxide etch.


                                  the chamber and power level of each source was established such that arc transients were intentionally
                                  created. The trace with more cycles for the given time period in Fig. 6.11 is the measured frequency
                                  for the 2-MHz RF source and the trace with three complete cycles is the measured frequency of the
                                  27-MHz RF source. The discontinuities in the traces with three complete periods are correlated to the
                                  occurrence of arcs in the plasma. This demonstrates the rigid ability to maintain lock to the frequency
                                  of multiple RF sources in a worse-case environment. Also apparent is the ability to detect plasma arc
                                  transients. Extensions of arc detection include arc classification and suppression controls.
                                    Figure 6.12 illustrates before and after effects of an oxide etch. The illustration on the left in this
                                  figure shows the presence of oxide in a trench prior to initiating an etch. The circuit diagram of the
                                  capacitor-divider circuit is a simplification of the resulting change in the impedance measured by the
                                  voltage/current sensor and analysis module. As the ion bombardment penetrates the trench and
                                  removes the oxide, the impedance of the plasma varies. Monitoring the harmonics generated from
                                  the plasma has proven to be an effective method of monitoring the etch process. 49,53,54  Real-time
                                  feedback control and monitoring of the impedance during the etch process has been demonstrated to
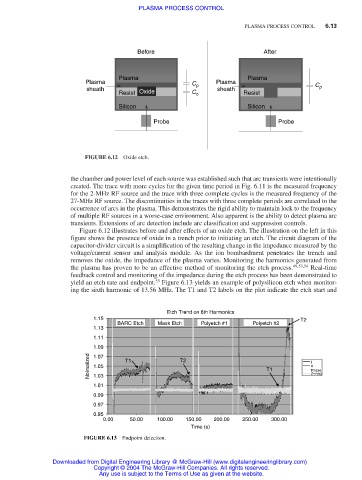
                                  yield an etch rate and endpoint. Figure 6.13 yields an example of polysilicon etch when monitor-
                                                         55
                                  ing the sixth harmonic of 13.56 MHz. The T1 and T2 labels on the plot indicate the etch start and

                                                            Etch Trend on 6th Harmonics
                                        1.15                                                    T2
                                               BARC Etch  Mask Etch  Polyetch #1   Polyetch #2
                                        1.13
                                        1.11
                                        1.09
                                       Noimalized  1.05  T1     T2                     T1          I V Phase
                                        1.07
                                                                                                   Z-mag
                                        1.03
                                        1.01
                                        0.99
                                        0.97
                                        0.95
                                           0.00   50.00  100.00  150.00  200.00  250.00  300.00
                                                                   Time (s)
                                      FIGURE 6.13  Endpoint detection.


                             Downloaded from Digital Engineering Library @ McGraw-Hill (www.digitalengineeringlibrary.com)
                                        Copyright © 2004 The McGraw-Hill Companies. All rights reserved.
                                          Any use is subject to the Terms of Use as given at the website.
   69   70   71   72   73   74   75   76   77   78   79