
Page 75 - Semiconductor Manufacturing Handbook
P. 75
Geng(SMH)_CH06.qxd 04/04/2005 19:37 Page 6.14
PLASMA PROCESS CONTROL
6.14 SEMICONDUCTOR FUNDAMENTALS AND BASIC MATERIALS
etch endpoint respectively from an optical emission spectroscopy sensor. The RF signals have been
normalized to illustrate that measuring multiple RF parameters can achieve a robust method of mea-
suring the etch rate and endpoint. Analogous to controlling etch, a voltage/current sensor and the
associated analysis module have proven to be an effective means of chamber excursion detection and
clean optimization. 48,56
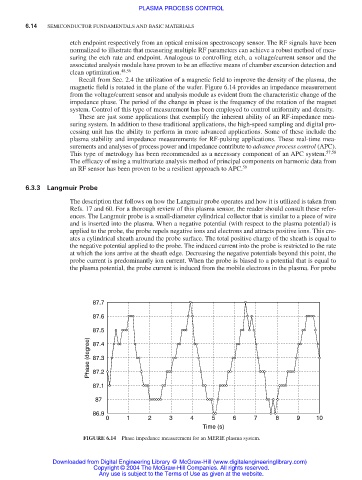
Recall from Sec. 2.4 the utilization of a magnetic field to improve the density of the plasma, the
magnetic field is rotated in the plane of the wafer. Figure 6.14 provides an impedance measurement
from the voltage/current sensor and analysis module as evident from the characteristic change of the
impedance phase. The period of the change in phase is the frequency of the rotation of the magnet
system. Control of this type of measurement has been employed to control uniformity and density.
These are just some applications that exemplify the inherent ability of an RF-impedance mea-
suring system. In addition to these traditional applications, the high-speed sampling and digital pro-
cessing unit has the ability to perform in more advanced applications. Some of these include the
plasma stability and impedance measurements for RF-pulsing applications. These real-time mea-
surements and analyses of process power and impedance contribute to advance process control (APC).
This type of metrology has been recommended as a necessary component of an APC system. 57,58
The efficacy of using a multivariate analysis method of principal components on harmonic data from
an RF sensor has been proven to be a resilient approach to APC. 59
6.3.3 Langmuir Probe
The description that follows on how the Langmuir probe operates and how it is utilized is taken from
Refs. 17 and 60. For a thorough review of this plasma sensor, the reader should consult these refer-
ences. The Langmuir probe is a small-diameter cylindrical collector that is similar to a piece of wire
and is inserted into the plasma. When a negative potential (with respect to the plasma potential) is
applied to the probe, the probe repels negative ions and electrons and attracts positive ions. This cre-
ates a cylindrical sheath around the probe surface. The total positive charge of the sheath is equal to
the negative potential applied to the probe. The induced current into the probe is restricted to the rate
at which the ions arrive at the sheath edge. Decreasing the negative potentials beyond this point, the
probe current is predominantly ion current. When the probe is biased to a potential that is equal to
the plasma potential, the probe current is induced from the mobile electrons in the plasma. For probe
87.7
87.6
87.5
Phase (degree) 87.4
87.3
87.2
87.1
87
86.9
0 1 2 3 4 5 6 7 8 9 10
Time (s)
FIGURE 6.14 Phase impedance measurement for an MERIE plasma system.
Downloaded from Digital Engineering Library @ McGraw-Hill (www.digitalengineeringlibrary.com)
Copyright © 2004 The McGraw-Hill Companies. All rights reserved.
Any use is subject to the Terms of Use as given at the website.