
Page 287 - Separation process engineering
P. 287
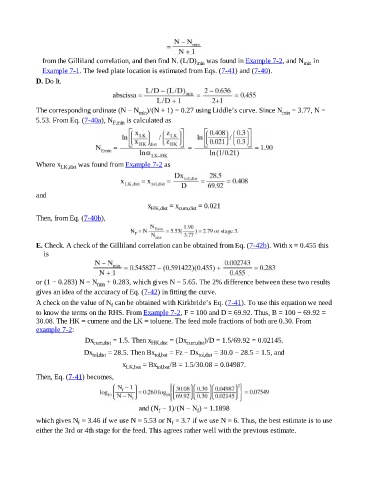
from the Gilliland correlation, and then find N. (L/D)      min  was found in Example 7-2, and N      min  in

                         Example 7-1. The feed plate location is estimated from Eqs. (7-41) and (7-40).
                      D. Do It.


                      The corresponding ordinate (N − N       min )/(N + 1) = 0.27 using Liddle’s curve. Since N       min  = 3.77, N =

                      5.53. From Eq. (7-40a), N     F,min  is calculated as


                      Where x          was found from Example 7-2 as
                                LK,dist


                      and

                                                                  x HK,dist  = x cum,dist  = 0.021
                      Then, from Eq. (7-40b),


                      E. Check. A check of the Gilliland correlation can be obtained from Eq. (7-42b). With x = 0.455 this
                         is


                      or (1 − 0.283) N = N        + 0.283, which gives N = 5.65. The 2% difference between these two results
                                              min
                      gives an idea of the accuracy of Eq. (7-42) in fitting the curve.

                      A check on the value of N  can be obtained with Kirkbride’s Eq. (7-41). To use this equation we need
                                                    f
                      to know the terms on the RHS. From Example 7-2, F = 100 and D = 69.92. Thus, B = 100 − 69.92 =
                      30.08. The HK = cumene and the LK = toluene. The feed mole fractions of both are 0.30. From
                      example 7-2:
                                         Dx  cum,dist  = 1.5. Then x HK,dist  = (Dx cum,dist )/D = 1.5/69.92 = 0.02145.

                                         Dx tol,dist  = 28.5. Then Bx tol,bot  = Fz − Dx tol,dist  = 30.0 − 28.5 = 1.5, and

                                                        x LK,bot  = Bx tol,bot /B = 1.5/30.08 = 0.04987.

                      Then, Eq. (7-41) becomes,


                                                              and (N  − 1)/(N − N ) = 1.1898
                                                                      f
                                                                                     f
                      which gives N  = 3.46 if we use N = 5.53 or N  = 3.7 if we use N = 6. Thus, the best estimate is to use
                                       f                                   f
                      either the 3rd or 4th stage for the feed. This agrees rather well with the previous estimate.