
Page 312 - Separation process engineering
P. 312
In Chapter 3 we developed Eq. (3-3) for binary separations. This equation applies to each component in
the binary separations. For example, for separation of intermediate and heavy components,
(8-26)
Equation (8-26) remains valid if a third (or fourth or more) components are present in the distillation, and
we can write a similar equation for every component. Thus, Eq. (8-26) applies for the general ternary
separation shown as line BFD. This equation also proves that the points representing bottoms, distillate
and feed all lie on a straight line and that the lever-arm rule applies. [This is very similar to the graphical
solution developed for the enthalpy-composition diagram of Figure 2-9 and the lever-arm rule derived in
Eq. (2-26). The rules for mass balances on triangular diagrams will be developed in detail in Section 13-
8.] As a first approximation, the points representing the bottoms and distillate products from a distillation
column with a single feed will lie on the distillation and residue curves. The path traced from distillate to
bottoms must follow the same direction as the arrows (increasing temperature). Thus, these curves will
show us if the separation indicated by the line BFD is feasible. If there is a distillation boundary as in
Figure 8-8, not all separations will be feasible.
8.5.2 Residue Curves
We could do all of our calculations with distillation curves at total and finite reflux ratios; however, these
curves depend to some extent on the distillation system. It is convenient to use a thermodynamically based
curve that does not depend on the number of stages. A residue curve is generated by putting a mixture in a
still pot and boiling it without reflux until the pot runs dry and only the residue remains. This is a simple
batch distillation that will be discussed in more detail in Chapter 9. The plot of the changing mole fracs
on a triangular diagram is the residue curve. It will be similar but not identical to the distillation curves
shown in Figures 8-7 and 8-8. The differences between distillation curves and residue curves are
explored by Widagdo and Seider (1996).
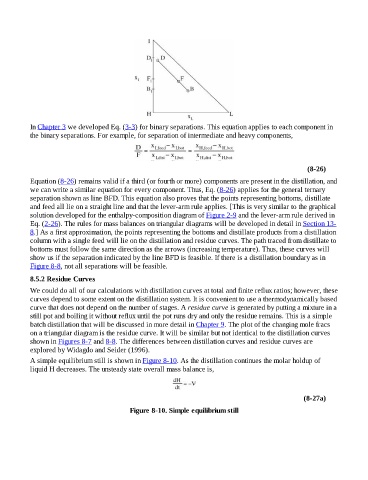
A simple equilibrium still is shown in Figure 8-10. As the distillation continues the molar holdup of
liquid H decreases. The unsteady state overall mass balance is,
(8-27a)
Figure 8-10. Simple equilibrium still