
Page 311 - Separation process engineering
P. 311
(8-25a)
Alternation of these two equations results in values for x , x , and x on every stage. These values (see
C
B
A
Example 8-3) are then plotted in Figures 8-7 and 8-8. The starting mole fracs are chosen so that the
distillation curves fill the entire space of the diagrams. If the relative volatility is constant, then the vapor
mole fracs can be easily calculated from Eq. (5-30). Substituting Eq. (5-30) into Eq. (8-25a) and solving
for x i,j+1 , we obtain the recursion relationship for the distillation curve for constant relative volatility
systems.
(8-25b)
Figure 8-7 shows the characteristic pattern of distillation curves for ideal or close to ideal VLE with no
azeotropes. All of the systems considered in Chapters 5, 6, and 7 follow this pattern. The y-axis (x = 0)
B
represents the binary A-C separation. This starts at the reboiler (x = 0.01 is an arbitrary value) and
A
requires only the reboiler plus 4 stages to reach a distillate value of x = 0.994. The x axis (x = 0)
A
A
represents the binary B-C separation, which was started at the arbitrary value x = 0.01 in the reboiler.
B
The maximum in B concentration should be familiar from the profiles shown in Chapter 5. Distillation
curves at finite reflux ratios are similar but not identical to those at total reflux. Note that the entire space
of the diagram can be reached by starting with concentrations near 100% C (the heavy boiler).
Distillation curves are usually plotted as smooth curves—they were plotted as discrete points in this
diagram to emphasize the location of the stages. The arrows are traditionally shown in the direction of
increasing temperature. Your understanding of the procedure for plotting these curves will be aided
significantly by studying Example 8-3 and by doing Problem 8.H1.
Figure 8-8 (Biegler et al., 1997) shows the total reflux distillation curves for acetone, chloroform,
benzene distillation on an equilateral triangle diagram. This system has a maximum boiling azeotrope
between acetone (x acetone ~ 0.34) and chloroform. To reach compositions on the right side of the diagram
we need to start with locations that are to the right of distillation boundary curve c. For compositions on
the left side of the diagram we have to start with locations that are to the left of the distillation boundary.
For a given feed concentration, only part of the space in Figure 8-8 can be reached for distillate and
bottoms products. If we want to produce pure acetone in a single column, the feed needs to be to the left
of the distillation boundary. To produce pure chloroform, the feed needs to be to the right of the
distillation boundary. Although the distillation boundary will move slightly at finite reflux ratios, this
basic principle still holds. Figure 8-8 is unusual because it shows a relatively rare maximum boiling
azeotrope. All of the other systems we will consider are the much more common minimum boiling
azeotropes.
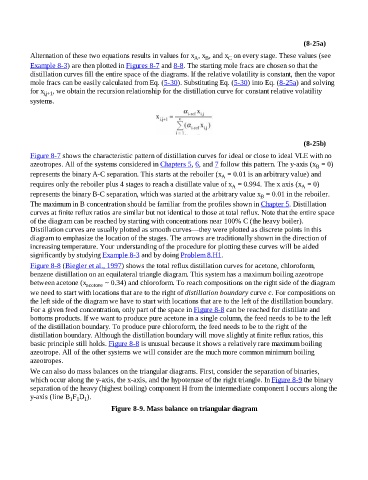
We can also do mass balances on the triangular diagrams. First, consider the separation of binaries,
which occur along the y-axis, the x-axis, and the hypotenuse of the right triangle. In Figure 8-9 the binary
separation of the heavy (highest boiling) component H from the intermediate component I occurs along the
y-axis (line B F D ).
1 1 1
Figure 8-9. Mass balance on triangular diagram