
Page 309 - Separation process engineering
P. 309
do not exhibit azeotropic behavior. In Chapter 4 when we studied both relatively ideal and azeotropic
binary systems we found that there were significant differences between these systems. If no azeotrope
forms, one can obtain essentially pure distillate and pure bottom products. If there is an azeotrope we
found that one can at best obtain one pure product and the azeotrope. In Section 8.2 we found that if the
binary azeotrope was heterogeneous one could usually use a liquid-liquid separator to get past the
azeotrope and obtain two pure products with two columns. Ternary systems with nonideal VLE can have
one or more azeotropes that may be homogeneous or heterogeneous. Since the behavior of ideal ternary
distillation is more complex than that of ideal binary distillation, we expect that the behavior of nonideal
ternary distillation is probably more complex than nonideal binary distillation.
Although McCabe-Thiele diagrams can be used for ternary systems, they have not been nearly as
successful as the binary applications. Hengstebeck (1961) developed a pseudo-binary approach that is
useful for systems with close to ideal VLE. It has also been applied to extractive distillation by assuming
the solvent concentration is constant. Chambers (1951) developed a method that could be applied with
fewer assumptions to systems with azeotropes and illustrated it with the ternary system methanol-ethanol-
water. His approach consisted of drawing two McCabe-Thiele diagrams (e.g., one for methanol and one
for ethanol). Equilibrium consists of several curves with methanol mole frac as a parameter on the ethanol
diagram and ethanol mole frac as a parameter on the methanol diagram. Each equilibrium step required
simultaneous solution of the two diagrams (see Wankat, 1981). The operating lines plot on these diagrams
in the normal fashion. Although visually instructive, Chambers’s method is awkward and has not been
widely used. The conclusion is we need new visualization tools to study ternary distillation.
8.5.1 Distillation Curves
You may have noticed in Chapter 2 that enthalpy-composition and temperature-composition diagrams
contain more information than the McCabe-Thiele y-x diagram. We started using the diagram with less
information because it was easier to show the patterns and visualize the separation. For ternary
distillation we will repeat this pattern and go to a ternary composition diagram that shows the paths taken
by liquid mole fracs throughout a distillation operation. We gain in visualization power since a variety of
possible paths are easy to illustrate, but we lose power since the stages are no longer shown. For
complex systems the gains are much more important than the losses.
A distillation curve is a plot of the mole fracs on every tray for distillation. Distillation curves can be
generated at total reflux or finite reflux. If you have run a multicomponent distillation simulation or solved
a ternary distillation problem with a hand calculation, you have obtained the information (x for j =
i,j
1,...N) necesary to plot a distillation curve. Thus, what is different is the presentation. The two different
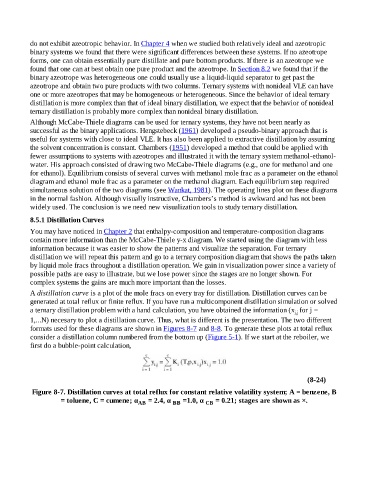
formats used for these diagrams are shown in Figures 8-7 and 8-8. To generate these plots at total reflux
consider a distillation column numbered from the bottom up (Figure 5-1). If we start at the reboiler, we
first do a bubble-point calculation,
(8-24)
Figure 8-7. Distillation curves at total reflux for constant relative volatility system; A = benzene, B
= toluene, C = cumene; α AB = 2.4, α BB =1.0, α CB = 0.21; stages are shown as ×.