
Page 81 - Separation process principles 2
P. 81
46 Chapter 2 Thermodynamics of Separation Operations
Pressure, psia
0.5 0.6 0.7 0.8 0.9 1 .O
Curves represent experimental data of:
Reduced temperature, TIT, Kay et al. (Ohio State Univ.) Robinson et al. (Univ. Alberta)
Figure 2.12 Reduced vapor pressure. Sage et al. (Calif. Inst. Tech.) Thodos (Northwestern)
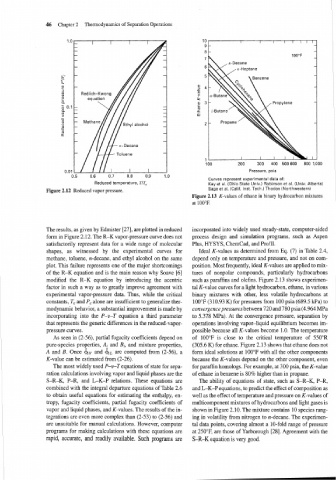
Figure 2.13 K-values of ethane in binary hydrocarbon mixtures
at 100°F.
The results, as given by Edmister [27], are plotted in reduced incorporated into widely used steady-state, computer-aided
form in Figure 2.12. The R-K vapor-pressure curve does not process design and simulation programs, such as Aspen
satisfactorily represent data for a wide range of molecular Plus, HYSYS, ChemCad, and ProIII.
shapes, as witnessed by the experimental curves for Ideal K-values as determined from Eq. (7) in Table 2.4,
methane, toluene, n-decane, and ethyl alcohol on the same depend only on temperature and pressure, and not on com-
plot. This failure represents one of the major shortcomings position. Most frequently, ideal K-values are applied to mix-
of the R-K equation and is the main reason why Soave [6] tures of nonpolar compounds, particularly hydrocarbons
modified the R-K equation by introducing the acentric such as paraffins and olefins. Figure 2.13 shows experimen-
factor in such a way as to greatly improve agreement with tal K-value curves for a light hydrocarbon, ethane, in various
experimental vapor-pressure data. Thus, while the critical binary mixtures with other, less volatile hydrocarbons at
constants, T, and PC alone are insufficient to generalize ther- 100°F (310.93 K) for pressures from 100 psia (689.5 kPa) to
modynamic behavior, a substantial improvement is made by convergence pressures between 720 and 780 psia (4.964 MPa
incorporating into the P-V-T equation a third parameter to 5.378 MPa). At the convergence pressure, separation by
that represents the generic differences in the reduced-vapor- operations involving vapor-liquid equilibrium becomes im-
pressure curves. possible because all K-values become 1.0. The temperature
As seen in (2-56), partial fugacity coefficients depend on of 100°F is close to the critical temperature of 550"R
pure-species properties, A, and B,, and mixture properties, (305.6 K) for ethane. Figure 2.13 shows that ethane does not
A and B. Once Gv and &L are computed from (2-56), a form ideal solutions at 100°F with all the other components
K-value can be estimated from (2-26). because the K-values depend on the other component, even
The most widely used P-V-T equations of state for sepa- for paraffin homologs. For example, at 300 psia, the K-value
ration calculations involving vapor and liquid phases are the of ethane in benzene is 80% higher than in propane.
S-R-K, P-R, and L-K-P relations. These equations are The ability of equations of state, such as S-R-K, P-R,
combined with the integral departure equations of Table 2.6 and L-K-P equations, to predict the effect of composition as
to obtain useful equations for estimating the enthalpy, en- well as the effect of temperature and pressure on K-values of
tropy, fugacity coefficients, partial fugacity coefficients of multicomponent mixtures of hydrocarbons and light gases is
vapor and liquid phases, and K-values. The results of the in- shown in Figure 2.10. The mixture contains 10 species rang-
tegrations are even more complex than (2-53) to (2-56) and ing in volatility from nitrogen to n-decane. The experimen-
are unsuitable for manual calculations. However, computer tal data points, covering almost a 10-fold range of pressure
programs for making calculations with these equations are at 250°F, are those of Yarborough [28]. Agreement with the
rapid, accurate, and readily available. Such programs are S-R-K equation is very good.