
Page 116 - Shigley's Mechanical Engineering Design
P. 116
bud29281_ch03_071-146.qxd 11/24/09 3:01PM Page 91 ntt 203:MHDQ196:bud29281:0073529281:bud29281_pagefiles:
Load and Stress Analysis 91
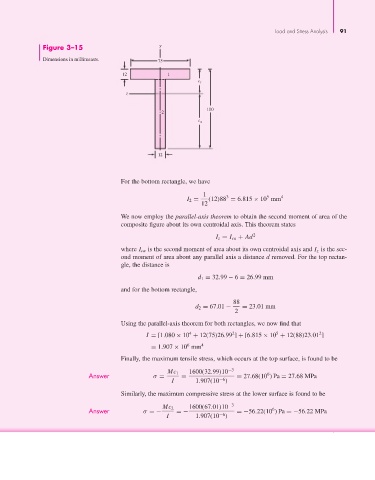
Figure 3–15 y
Dimensions in millimeters. 75
12 1
c 1
z
100
2
c 2
12
For the bottom rectangle, we have
1 3 5 4
I 2 = (12)88 = 6.815 × 10 mm
12
We now employ the parallel-axis theorem to obtain the second moment of area of the
composite figure about its own centroidal axis. This theorem states
I z = I ca + Ad 2
where I ca is the second moment of area about its own centroidal axis and I z is the sec-
ond moment of area about any parallel axis a distance d removed. For the top rectan-
gle, the distance is
d 1 = 32.99 − 6 = 26.99 mm
and for the bottom rectangle,
88
d 2 = 67.01 − = 23.01 mm
2
Using the parallel-axis theorem for both rectangles, we now find that
5
2
2
4
I = [1.080 × 10 + 12(75)26.99 ] + [6.815 × 10 + 12(88)23.01 ]
6
= 1.907 × 10 mm 4
Finally, the maximum tensile stress, which occurs at the top surface, is found to be
6
Answer σ = Mc 1 = 1600(32.99)10 −3 = 27.68(10 )Pa = 27.68 MPa
−6
I 1.907(10 )
Similarly, the maximum compressive stress at the lower surface is found to be
Answer σ =− Mc 2 =− 1600(67.01)10 −3 =−56.22(10 )Pa =−56.22 MPa
6
−6
I 1.907(10 )