Page 121 - Shigley's Mechanical Engineering Design
P. 121

bud29281_ch03_071-146.qxd  11/24/09  3:01PM  Page 96 ntt 203:MHDQ196:bud29281:0073529281:bud29281_pagefiles:


                 96    Mechanical Engineering Design
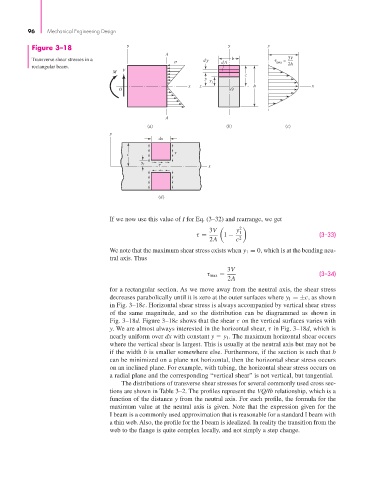
                  Figure 3–18                  y                              y            y
                                                           A
                  Transverse shear stresses in a                       dy       b                =  3V
                                                                            dA               max  2A
                  rectangular beam.
                                           M  V
                                                                                    c
                                                                       y
                                                                         y 1
                                                                  x   z               h                 x
                                             O                                 O

                                                           A
                                                      (a)                     (b)               (c)
                                          y
                                                         dx

                                               c
                                                    y
                                                    1                   x


                                                         (d)


                                          If we now use this value of I for Eq. (3–32) and rearrange, we get
                                                                         3V      y 1 2
                                                                     τ =     1 −                           (3–33)
                                                                         2A      c 2
                                          We note that the maximum shear stress exists when y 1 = 0, which is at the bending neu-
                                          tral axis. Thus
                                                                              3V
                                                                        τ max =                            (3–34)
                                                                              2A
                                          for a rectangular section. As we move away from the neutral axis, the shear stress
                                          decreases parabolically until it is zero at the outer surfaces where y 1 =±c, as shown
                                          in Fig. 3–18c. Horizontal shear stress is always accompanied by vertical shear stress
                                          of the same magnitude, and so the distribution can be diagrammed as shown in
                                          Fig. 3–18d. Figure 3–18c shows that the shear τ on the vertical surfaces varies with
                                          y. We are almost always interested in the horizontal shear, τ in Fig. 3–18d, which is
                                          nearly uniform over dx with constant y   y 1 . The maximum horizontal shear occurs
                                          where the vertical shear is largest. This is usually at the neutral axis but may not be
                                          if the width b is smaller somewhere else. Furthermore, if the section is such that b
                                          can be minimized on a plane not horizontal, then the horizontal shear stress occurs
                                          on an inclined plane. For example, with tubing, the horizontal shear stress occurs on
                                          a radial plane and the corresponding “vertical shear” is not vertical, but tangential.
                                              The distributions of transverse shear stresses for several commonly used cross sec-
                                          tions are shown in Table 3–2. The profiles represent the VQ/Ib relationship, which is a
                                          function of the distance y from the neutral axis. For each profile, the formula for the
                                          maximum value at the neutral axis is given. Note that the expression given for the
                                          I beam is a commonly used approximation that is reasonable for a standard I beam with
                                          a thin web. Also, the profile for the I beam is idealized. In reality the transition from the
                                          web to the flange is quite complex locally, and not simply a step change.
   116   117   118   119   120   121   122   123   124   125   126