
Page 320 - Shigley's Mechanical Engineering Design
P. 320
bud29281_ch06_265-357.qxd 12/7/09 7:25PM Page 295 ntt 203:MHDQ196:bud29281:0073529281:bud29281_pagefiles:
Fatigue Failure Resulting from Variable Loading 295
6–10 Stress Concentration and Notch Sensitivity
In Sec. 3–13 it was pointed out that the existence of irregularities or discontinuities,
such as holes, grooves, or notches, in a part increases the theoretical stresses signifi-
cantly in the immediate vicinity of the discontinuity. Equation (3–48) defined a stress-
concentration factor K t (or K ts ), which is used with the nominal stress to obtain the
maximum resulting stress due to the irregularity or defect. It turns out that some mate-
rials are not fully sensitive to the presence of notches and hence, for these, a reduced
value of K t can be used. For these materials, the effective maximum stress in fatigue is,
or (6–30)
σ max = K f σ 0 τ max = K fs τ 0
where K f is a reduced value of K t and σ 0 is the nominal stress. The factor K f is com-
monly called a fatigue stress-concentration factor, and hence the subscript f. So it is
convenient to think of K f as a stress-concentration factor reduced from K t because of
lessened sensitivity to notches. The resulting factor is defined by the equation
maximum stress in notched specimen
K f = (a)
stress in notch-free specimen
Notch sensitivity q is defined by the equation
K f − 1 K fs − 1
q = or q shear = (6–31)
K t − 1 K ts − 1
where q is usually between zero and unity. Equation (6–31) shows that if q = 0, then
K f = 1, and the material has no sensitivity to notches at all. On the other hand, if
q = 1, then K f = K t , and the material has full notch sensitivity. In analysis or design
work, find K t first, from the geometry of the part. Then specify the material, find q, and
solve for K f from the equation
K f = 1 + q(K t − 1) or K fs = 1 + q shear (K ts − 1) (6–32)
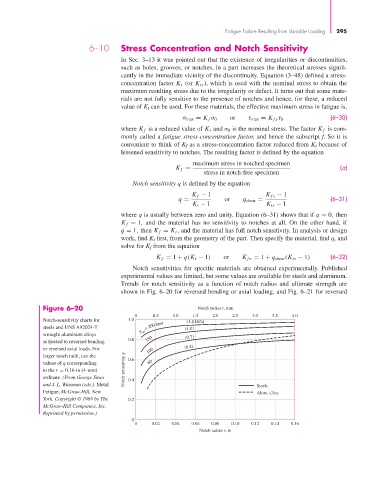
Notch sensitivities for specific materials are obtained experimentally. Published
experimental values are limited, but some values are available for steels and aluminum.
Trends for notch sensitivity as a function of notch radius and ultimate strength are
shown in Fig. 6–20 for reversed bending or axial loading, and Fig. 6–21 for reversed
Figure 6–20 Notch radius r, mm
0 0.5 1.0 1.5 2.0 2.5 3.0 3.5 4.0
Notch-sensitivity charts for 1.0 (1.4 GPa)
steels and UNS A92024-T = 200 kpsi (1.0)
S ut
wrought aluminum alloys
0.8 150 (0.7)
subjected to reversed bending
(0.4)
or reversed axial loads. For 100
larger notch radii, use the
values of q corresponding 0.6 60
to the r = 0.16-in (4-mm) Notch sensitivity q
ordinate. (From George Sines 0.4
and J. L. Waisman (eds.), Metal Steels
Fatigue, McGraw-Hill, New Alum. alloy
York. Copyright © 1969 by The 0.2
McGraw-Hill Companies, Inc.
Reprinted by permission.)
0
0 0.02 0.04 0.06 0.08 0.10 0.12 0.14 0.16
Notch radius r, in