Page 321 - Shigley's Mechanical Engineering Design
P. 321

bud29281_ch06_265-357.qxd  12/11/2009  4:56 pm  Page 296 pinnacle 203:MHDQ196:bud29281:0073529281:bud29281_pagefiles:


                 296   Mechanical Engineering Design
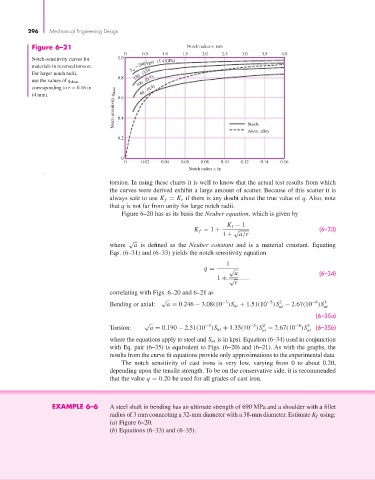
                  Figure 6–21                                     Notch radius r, mm
                                              0     0.5   1.0   1.5   2.0    2.5   3.0   3.5   4.0
                  Notch-sensitivity curves for  1.0
                  materials in reversed torsion.  = 200 kpsi (1.4 GPa)
                                                 S ut
                  For larger notch radii,         150   (1.0)
                                            0.8
                  use the values of q shear       100   (0.7)
                  corresponding to r = 0.16 in      60   (0.4)
                                           Notch sensitivity q shear  0.4
                  (4 mm).                   0.6


                                                                                     Steels
                                                                                     Alum. alloy
                                            0.2


                                              0
                                              0     0.02  0.04  0.06  0.08  0.10  0.12  0.14   0.16
                                                                  Notch radius r, in
                                          torsion. In using these charts it is well to know that the actual test results from which
                                          the curves were derived exhibit a large amount of scatter. Because of this scatter it is
                                          always safe to use K f = K t if there is any doubt about the true value of q. Also, note
                                          that q is not far from unity for large notch radii.
                                              Figure 6–20 has as its basis the Neuber equation, which is given by
                                                                              K t − 1
                                                                    K f = 1 +   √                          (6–33)
                                                                             1 +  a/r
                                                √
                                          where   a is defined as the  Neuber constant and is a material constant. Equating
                                          Eqs. (6–31) and (6–33) yields the notch sensitivity equation
                                                                              1
                                                                       q =     √
                                                                                a                          (6–34)
                                                                           1 + √
                                                                                r
                                          correlating with Figs. 6–20 and 6–21 as
                                                          √                  −3           −5  2         −8  3
                                          Bending or axial:  a = 0.246 − 3.08(10 )S ut + 1.51(10 )S − 2.67(10 )S ut
                                                                                              ut
                                                                                                         (6–35a)
                                                     √                 −3            −5  2         −8  3
                                          Torsion:    a = 0.190 − 2.51(10 )S ut + 1.35(10 )S − 2.67(10 )S ut  (6–35b)
                                                                                         ut
                                          where the equations apply to steel and S ut is in kpsi. Equation (6–34) used in conjunction
                                          with Eq. pair (6–35) is equivalent to Figs. (6–20) and (6–21). As with the graphs, the
                                          results from the curve fit equations provide only approximations to the experimental data.
                                              The notch sensitivity of cast irons is very low, varying from 0 to about 0.20,
                                          depending upon the tensile strength. To be on the conservative side, it is recommended
                                          that the value q = 0.20 be used for all grades of cast iron.


                        EXAMPLE 6–6       A steel shaft in bending has an ultimate strength of 690 MPa and a shoulder with a fillet
                                          radius of 3 mm connecting a 32-mm diameter with a 38-mm diameter. Estimate K f using:
                                          (a) Figure 6–20.
                                          (b) Equations (6–33) and (6–35).
   316   317   318   319   320   321   322   323   324   325   326