
Page 328 - Shigley's Mechanical Engineering Design
P. 328
bud29281_ch06_265-357.qxd 11/30/2009 4:23 pm Page 303 pinnacle s-171:Desktop Folder:Temp Work:Don't Delete (Jobs):MHDQ196/Budynas:
Fatigue Failure Resulting from Variable Loading 303
6–12 Fatigue Failure Criteria for Fluctuating Stress
Now that we have defined the various components of stress associated with a part sub-
jected to fluctuating stress, we want to vary both the midrange stress and the stress
amplitude, or alternating component, to learn something about the fatigue resistance of
parts when subjected to such situations. Three methods of plotting the results of such
tests are in general use and are shown in Figs. 6–24, 6–25, and 6–26.
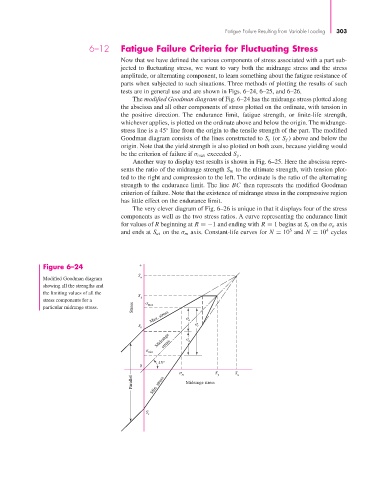
The modified Goodman diagram of Fig. 6–24 has the midrange stress plotted along
the abscissa and all other components of stress plotted on the ordinate, with tension in
the positive direction. The endurance limit, fatigue strength, or finite-life strength,
whichever applies, is plotted on the ordinate above and below the origin. The midrange-
stress line is a 45 line from the origin to the tensile strength of the part. The modified
◦
Goodman diagram consists of the lines constructed to S e (or S f ) above and below the
origin. Note that the yield strength is also plotted on both axes, because yielding would
be the criterion of failure if σ max exceeded S y .
Another way to display test results is shown in Fig. 6–25. Here the abscissa repre-
sents the ratio of the midrange strength S m to the ultimate strength, with tension plot-
ted to the right and compression to the left. The ordinate is the ratio of the alternating
strength to the endurance limit. The line BC then represents the modified Goodman
criterion of failure. Note that the existence of midrange stress in the compressive region
has little effect on the endurance limit.
The very clever diagram of Fig. 6–26 is unique in that it displays four of the stress
components as well as the two stress ratios. A curve representing the endurance limit
for values of R beginning at R =−1 and ending with R = 1 begins at S e on the σ a axis
4
5
and ends at S ut on the σ m axis. Constant-life curves for N = 10 and N = 10 cycles
Figure 6–24 +
S
Modified Goodman diagram u
showing all the strengths and
the limiting values of all the
S
stress components for a y
particular midrange stress. Stress max
Max. stress a a
S r
e
Midrange a
stress
min
45°
0
m S y S u
Parallel Min. stress Midrange stress
S
e