
Page 330 - Shigley's Mechanical Engineering Design
P. 330
bud29281_ch06_265-357.qxd 11/30/2009 4:23 pm Page 305 pinnacle s-171:Desktop Folder:Temp Work:Don't Delete (Jobs):MHDQ196/Budynas:
Fatigue Failure Resulting from Variable Loading 305
Figure 6–27 S y
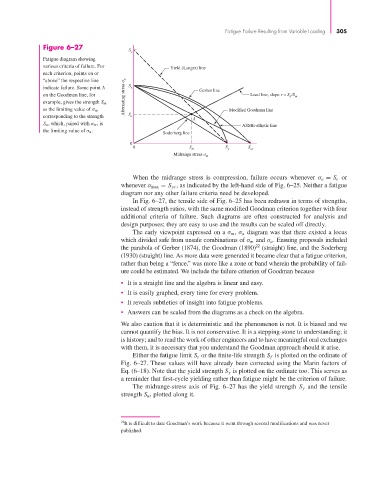
Fatigue diagram showing
various criteria of failure. For Yield (Langer) line
each criterion, points on or
“above” the respective line
indicate failure. Some point A S e Gerber line
on the Goodman line, for Alternating stress a Load line, slope r = S /S m
a
example, gives the strength S m
as the limiting value of σ m Modified Goodman line
corresponding to the strength S a
A
S a , which, paired with σ m , is ASME-elliptic line
the limiting value of σ a .
Soderberg line
0
0 S S S
m y ut
Midrange stress
m
When the midrange stress is compression, failure occurs whenever σ a = S e or
whenever σ max = S yc , as indicated by the left-hand side of Fig. 6–25. Neither a fatigue
diagram nor any other failure criteria need be developed.
In Fig. 6–27, the tensile side of Fig. 6–25 has been redrawn in terms of strengths,
instead of strength ratios, with the same modified Goodman criterion together with four
additional criteria of failure. Such diagrams are often constructed for analysis and
design purposes; they are easy to use and the results can be scaled off directly.
The early viewpoint expressed on a σ m , σ a diagram was that there existed a locus
which divided safe from unsafe combinations of σ m and σ a . Ensuing proposals included
22
the parabola of Gerber (1874), the Goodman (1890) (straight) line, and the Soderberg
(1930) (straight) line. As more data were generated it became clear that a fatigue criterion,
rather than being a “fence,” was more like a zone or band wherein the probability of fail-
ure could be estimated. We include the failure criterion of Goodman because
• It is a straight line and the algebra is linear and easy.
• It is easily graphed, every time for every problem.
• It reveals subtleties of insight into fatigue problems.
• Answers can be scaled from the diagrams as a check on the algebra.
We also caution that it is deterministic and the phenomenon is not. It is biased and we
cannot quantify the bias. It is not conservative. It is a stepping-stone to understanding; it
is history; and to read the work of other engineers and to have meaningful oral exchanges
with them, it is necessary that you understand the Goodman approach should it arise.
Either the fatigue limit S e or the finite-life strength S f is plotted on the ordinate of
Fig. 6–27. These values will have already been corrected using the Marin factors of
Eq. (6–18). Note that the yield strength S y is plotted on the ordinate too. This serves as
a reminder that first-cycle yielding rather than fatigue might be the criterion of failure.
The midrange-stress axis of Fig. 6–27 has the yield strength S y and the tensile
strength S ut plotted along it.
22 It is difficult to date Goodman’s work because it went through several modifications and was never
published.