
Page 334 - Shigley's Mechanical Engineering Design
P. 334
bud29281_ch06_265-357.qxd 12/02/2009 6:49 pm Page 309 pinnacle s-171:Desktop Folder:Temp Work:Don't Delete (Jobs):MHDQ196/Budynas:
Fatigue Failure Resulting from Variable Loading 309
k c = 0.85: Eq. (6–26), p. 290
k d = k e = k f = 1
S e = 0.797(1)0.850(1)(1)(1)0.5(100) = 33.9kpsi: Eqs. (6–8), (6–18), p. 282, p. 287
The nominal axial stress components σ ao and σ mo are
4F a 4(8) 4F m 4(8)
σ ao = = = 4.53 kpsi σ mo = = = 4.53 kpsi
πd 2 π1.5 2 πd 2 π1.5 2
Applying K f to both components σ ao and σ mo constitutes a prescription of no notch
yielding:
σ a = K f σ ao = 1.85(4.53) = 8.38 kpsi = σ m
(a) Let us calculate the factors of safety first. From the bottom panel from Table 6–7 the
factor of safety for fatigue is
⎧ ⎫
2
1 100 8.38 ⎨ 2(8.38)33.9 2⎬
Answer n f = −1 + 1 + = 3.66
2 8.38 33.9 ⎩ 100(8.38) ⎭
From Eq. (6–49) the factor of safety guarding against first-cycle yield is
Answer n y = S y = 84 = 5.01
σ a + σ m 8.38 + 8.38
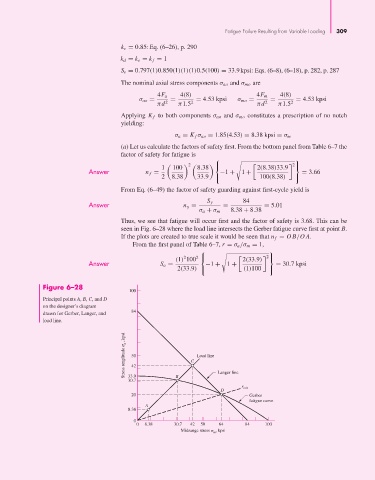
Thus, we see that fatigue will occur first and the factor of safety is 3.68. This can be
seen in Fig. 6–28 where the load line intersects the Gerber fatigue curve first at point B.
If the plots are created to true scale it would be seen that n f = OB/OA.
From the first panel of Table 6–7, r = σ a /σ m = 1,
⎧ ⎫
2
(1) 100 2 ⎨ 2(33.9) 2⎬
Answer S a = −1 + 1 + = 30.7 kpsi
(1)100
2(33.9) ⎩ ⎭
Figure 6–28
100
Principal points A, B, C, and D
on the designer’s diagram
drawn for Gerber, Langer, and 84
load line.
Stress amplitude a , kpsi 50 C Load line
42
33.9
30.7 B Langer line
r crit
D
20 Gerber
fatigue curve
A
8.38
0
0 8.38 30.7 42 50 64 84 100
Midrange stress , kpsi
m