
Page 335 - Shigley's Mechanical Engineering Design
P. 335
bud29281_ch06_265-357.qxd 11/30/2009 4:23 pm Page 310 pinnacle s-171:Desktop Folder:Temp Work:Don't Delete (Jobs):MHDQ196/Budynas:
310 Mechanical Engineering Design
Answer S m = S a = 30.7 = 30.7 kpsi
r 1
As a check on the previous result, n f = OB/OA = S a /σ a = S m /σ m = 30.7/8.38 =
3.66 and we see total agreement.
We could have detected that fatigue failure would occur first without drawing
Fig. 6–28 by calculating r crit . From the third row third column panel of Table 6–7, the
intersection point between fatigue and first-cycle yield is
⎡ ⎤
2
100 2 2(33.9) 84
S m = ⎣ 1 − 1 + 1 − ⎦ = 64.0 kpsi
2(33.9) 100 33.9
S a = S y − S m = 84 − 64 = 20 kpsi
The critical slope is thus
S a 20
r crit = = = 0.312
S m 64
which is less than the actual load line of r = 1. This indicates that fatigue occurs before
first-cycle-yield.
(b) Repeating the same procedure for the ASME-elliptic line, for fatigue
1
Answer n f = = 3.75
2
(8.38/33.9) + (8.38/84) 2
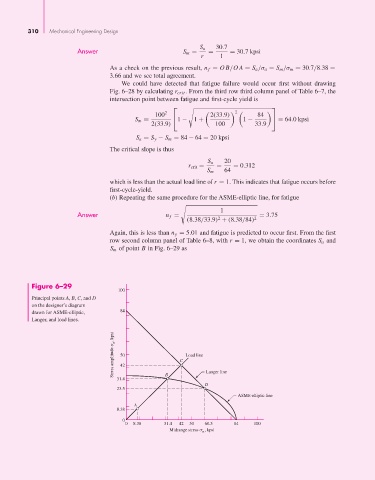
Again, this is less than n y = 5.01 and fatigue is predicted to occur first. From the first
row second column panel of Table 6–8, with r = 1, we obtain the coordinates S a and
S m of point B in Fig. 6–29 as
Figure 6–29
100
Principal points A, B, C, and D
on the designer’s diagram
drawn for ASME-elliptic, 84
Langer, and load lines.
Stress amplitude a , kpsi 50 C Load line
42
31.4 B Langer line
D
23.5
ASME-elliptic line
A
8.38
0
0 8.38 31.4 42 50 60.5 84 100
Midrange stress , kpsi
m