
Page 329 - Shigley's Mechanical Engineering Design
P. 329
bud29281_ch06_265-357.qxd 12/02/2009 9:29 pm Page 304 pinnacle s-171:Desktop Folder:Temp Work:Don't Delete (Jobs):MHDQ196/Budynas:
304 Mechanical Engineering Design
1.2
A B
1.0
Amplitude ratio S a /S' e 0.6
0.8
0.4
0.2
C
–1.2 –1.0 –0.8 –0.6 –0.4 –0.2 0 0.2 0.4 0.6 0.8 1.0
/S Tension S /S
Compression S m uc m ut
Midrange ratio
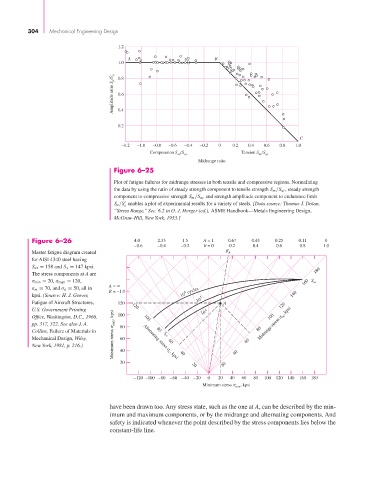
Figure 6–25
Plot of fatigue failures for midrange stresses in both tensile and compressive regions. Normalizing
the data by using the ratio of steady strength component to tensile strength S m /S ut , steady strength
component to compressive strength S m /S uc and strength amplitude component to endurance limit
S a /S enables a plot of experimental results for a variety of steels. [Data source: Thomas J. Dolan,
e
“Stress Range,” Sec. 6.2 in O. J. Horger (ed.), ASME Handbook—Metals Engineering Design,
McGraw-Hill, New York, 1953.]
Figure 6–26 4.0 2.33 1.5 A = 1 0.67 0.43 0.25 0.11 0
–0.6 –0.4 –0.2 R = 0 0.2 0.4 0.6 0.8 1.0
Master fatigue diagram created R A
for AISI 4340 steel having
S ut = 158 and S y = 147 kpsi.
The stress components at A are 180
σ min = 20, σ max = 120, 160 S ut
A =
σ m = 70, and σ a = 50, all in
R = –1.0 10 cycles
4
kpsi. (Source: H. J. Grover, 5 140
10
Fatigue of Aircraft Structures, 120 A
U.S. Government Printing 120 6 120 m , kpsi
Maximum stress max , kpsi S e
Office, Washington, D.C., 1966, 100 100 10 100
pp. 317, 322. See also J. A. 80
Collins, Failure of Materials in 80 80 Midrange stress
Mechanical Design, Wiley, 60 60 60
New York, 1981, p. 216.) 40 Alternating stress a , kpsi 40 40
20
20
20
–120 –100 –80 –60 –40 –20 0 20 40 60 80 100 120 140 160 180
Minimum stress min , kpsi
have been drawn too. Any stress state, such as the one at A, can be described by the min-
imum and maximum components, or by the midrange and alternating components. And
safety is indicated whenever the point described by the stress components lies below the
constant-life line.