
Page 154 - Six Sigma for electronics design and manufacturing
P. 154
123
Determining the Manufacturing Yield and Test Strategy
4.4.2 PCB test strategy example
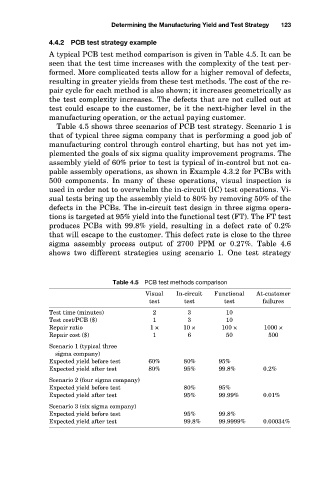
A typical PCB test method comparison is given in Table 4.5. It can be
seen that the test time increases with the complexity of the test per-
formed. More complicated tests allow for a higher removal of defects,
resulting in greater yields from these test methods. The cost of the re-
pair cycle for each method is also shown; it increases geometrically as
the test complexity increases. The defects that are not culled out at
test could escape to the customer, be it the next-higher level in the
manufacturing operation, or the actual paying customer.
Table 4.5 shows three scenarios of PCB test strategy. Scenario 1 is
that of typical three sigma company that is performing a good job of
manufacturing control through control charting, but has not yet im-
plemented the goals of six sigma quality improvement programs. The
assembly yield of 60% prior to test is typical of in-control but not ca-
pable assembly operations, as shown in Example 4.3.2 for PCBs with
500 components. In many of these operations, visual inspection is
used in order not to overwhelm the in-circuit (IC) test operations. Vi-
sual tests bring up the assembly yield to 80% by removing 50% of the
defects in the PCBs. The in-circuit test design in three sigma opera-
tions is targeted at 95% yield into the functional test (FT). The FT test
produces PCBs with 99.8% yield, resulting in a defect rate of 0.2%
that will escape to the customer. This defect rate is close to the three
sigma assembly process output of 2700 PPM or 0.27%. Table 4.6
shows two different strategies using scenario 1. One test strategy
Table 4.5 PCB test methods comparison
Visual In-circuit Functional At-customer
test test test failures
Test time (minutes) 2 3 10
Test cost/PCB ($) 1 3 10
Repair ratio 1 × 10 × 100 × 1000 ×
Repair cost ($) 1 6 50 500
Scenario 1 (typical three
sigma company)
Expected yield before test 60% 80% 95%
Expected yield after test 80% 95% 99.8% 0.2%
Scenario 2 (four sigma company)
Expected yield before test 80% 95%
Expected yield after test 95% 99.99% 0.01%
Scenario 3 (six sigma company)
Expected yield before test 95% 99.8%
Expected yield after test 99.8% 99.9999% 0.00034%