
Page 157 - Six Sigma for electronics design and manufacturing
P. 157
Six Sigma for Electronics Design and Manufacturing
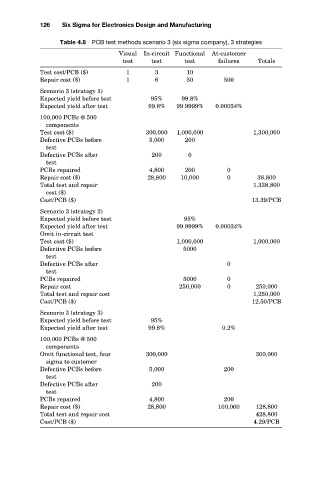
126
Table 4.8 PCB test methods scenario 3 (six sigma company), 3 strategies
failures
test
test
test
10
1
Test cost/PCB ($)
3
1
6
Repair cost ($)
50
500
Scenario 3 (strategy 1)
Expected yield before test
99.8%
95%
99.8%
99.9999%
Expected yield after test
0.00034%
100,000 PCBs @ 500
components Visual In-circuit Functional At-customer Totals
Test cost ($) 300,000 1,000,000 1,300,000
Defective PCBs before 5,000 200
test
Defective PCBs after 200 0
test
PCBs repaired 4,800 200 0
Repair cost ($) 28,800 10,000 0 38,800
Total test and repair 1,338,800
cost ($)
Cost/PCB ($) 13.39/PCB
Scenario 3 (strategy 2)
Expected yield before test 95%
Expected yield after test 99.9999% 0.00034%
Omit in-circuit test
Test cost ($) 1,000,000 1,000,000
Defective PCBs before 5000
test
Defective PCBs after 0
test
PCBs repaired 5000 0
Repair cost 250,000 0 250,000
Total test and repair cost 1,250,000
Cost/PCB ($) 12.50/PCB
Scenario 3 (strategy 3)
Expected yield before test 95%
Expected yield after test 99.8% 0.2%
100,000 PCBs @ 500
components
Omit functional test, four 300,000 300,000
sigma to customer
Defective PCBs before 5,000 200
test
Defective PCBs after 200
test
PCBs repaired 4,800 200
Repair cost ($) 28,800 100,000 128,800
Total test and repair cost 428,800
Cost/PCB ($) 4.29/PCB