Page 155 - Six Sigma for electronics design and manufacturing
P. 155

124
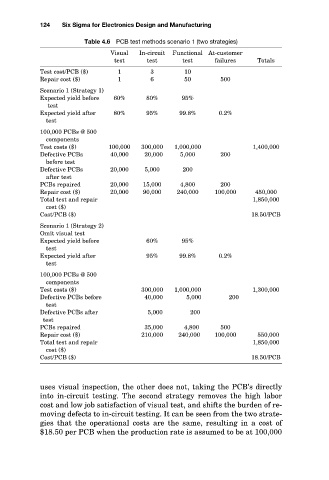
                                Table 4.6 PCB test methods scenario 1 (two strategies)
                                      Visual
                                                     Functional At-customer
                                             In-circuit
                                                        test
                                               test
                                       test
                                        1
                                                3
                                                        10
                     Test cost/PCB ($)
                                                        50
                                                                 500
                                        1
                     Repair cost ($)
                                                6
                     Scenario 1 (Strategy 1)
                                                       95%
                                               80%
                     Expected yield before
                                       60%
                       test
                                               95%
                                                       99.8%
                     Expected yield after
                                       80%
                                                                0.2%
                       test  Six Sigma for Electronics Design and Manufacturing  failures  Totals
                     100,000 PCBs @ 500
                       components
                     Test costs ($)   100,000  300,000  1,000,000       1,400,000
                     Defective PCBs   40,000   20,000  5,000     200
                       before test
                     Defective PCBs   20,000   5,000    200
                       after test
                     PCBs repaired    20,000  15,000   4,800     200
                     Repair cost ($)  20,000  90,000  240,000  100,000   450,000
                     Total test and repair                              1,850,000
                       cost ($)
                     Cost/PCB ($)                                       18.50/PCB
                     Scenario 1 (Strategy 2)
                     Omit visual test
                     Expected yield before     60%     95%
                       test
                     Expected yield after      95%     99.8%    0.2%
                       test
                     100,000 PCBs @ 500
                       components
                     Test costs ($)           300,000  1,000,000        1,300,000
                     Defective PCBs before     40,000    5,000     200
                       test
                     Defective PCBs after      5,000     200
                      test
                     PCBs repaired             35,000   4,800    500
                     Repair cost ($)          210,000  240,000  100,000   550,000
                     Total test and repair                              1,850,000
                       cost ($)
                     Cost/PCB ($)                                       18.50/PCB
                     uses visual inspection, the other does not, taking the PCB’s directly
                     into  in-circuit  testing.  The  second  strategy  removes  the  high  labor
                     cost and low job satisfaction of visual test, and shifts the burden of re-
                     moving defects to in-circuit testing. It can be seen from the two strate-
                     gies  that  the  operational  costs  are  the  same,  resulting  in  a  cost  of
                     $18.50 per PCB when the production rate is assumed to be at 100,000
   150   151   152   153   154   155   156   157   158   159   160