
Page 201 - Standard Handbook Of Petroleum & Natural Gas Engineering
P. 201
186 General Engineering and Science
P
Figure 2-25. Uniaxial loading of a bar.
an externally applied load will produce some deformation. The ratio of the deformation
to the undeformed length of the body is called the strain E. In the simple case illustrated
in Figure 2-25, the strain is
E = 6/L (2-72)
where 6 is the longitudinal deformation. The strain is tensile or compressive depending
upon the sign of 6. The relationship between stress and strain in an axially loaded
bar can be illustrated in a stress-strain curve (Figure 2-26). Such curves are
experimentally generated through tensile tests.
In the region where the relationship between stress and strain is linear, the material
is said to be elastic, and the constant of proportionality is E, Young's modulus, or the
elastic modulus.
(T = E& (2-73)
Equation 2-73 is called Hooke's law.
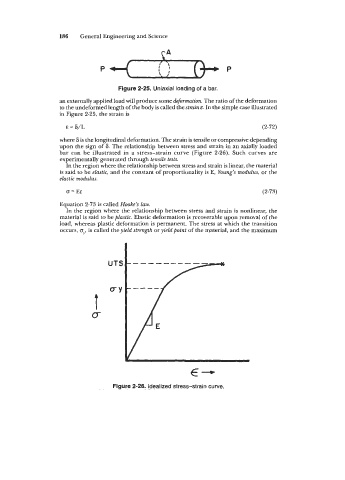
In the region where the relationship between stress and strain is nonlinear, the
material is said to be plastic. Elastic deformation is recoverable upon removal of the
load, whereas plastic deformation is permanent. The stress at which the transition
occurs, (T", is called the yield strength or yield point of the material, and the maximum
UTS
CY
t
cr
€-
Figure 2-26. Idealized stress-strain curve.