
Page 131 - Statistics for Dummies
P. 131
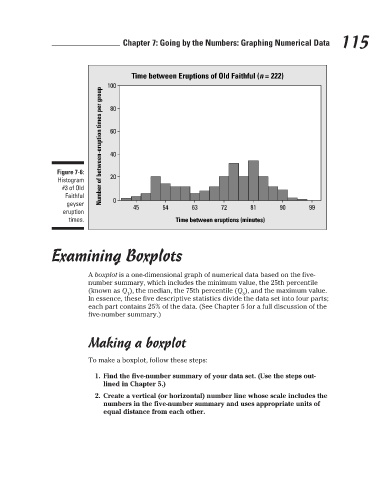
Time between Eruptions of Old Faithful (n = 222)
                                                          80
                                                          60
                                                          40
                                           Figure 7-6:
                                                          20
                                           Histogram
                                            #3 of Old
                                             Faithful
                                               geyser  Number of between-eruption times per group  100 0   Chapter 7: Going by the Numbers: Graphing Numerical Data  115
                                                                                                                 99
                                                                45
                                                                                                         90
                                                                                                 81
                                                                                         72
                                                                                 63
                                                                        54
                                             eruption
                                              times.                        Time between eruptions (minutes)

                                         Examining Boxplots
                                                    A boxplot is a one-dimensional graph of numerical data based on the five-
                                                    number summary, which includes the minimum value, the 25th percentile
                                                    (known as Q ), the median, the 75th percentile (Q ), and the maximum value.
                                                               1                               3
                                                    In essence, these five descriptive statistics divide the data set into four parts;
                                                    each part contains 25% of the data. (See Chapter 5 for a full discussion of the
                                                    five-number summary.)
                                                    Making a boxplot
                                                    To make a boxplot, follow these steps:
                                                      1. Find the five-number summary of your data set. (Use the steps out-
                                                        lined in Chapter 5.)
                                                      2. Create a vertical (or horizontal) number line whose scale includes the
                                                        numbers in the five-number summary and uses appropriate units of
                                                        equal distance from each other.


                                                                                                                           3/25/11   8:16 PM
                             12_9780470911082-ch07.indd   115                                                              3/25/11   8:16 PM
                             12_9780470911082-ch07.indd   115