Page 136 - Statistics for Dummies
P. 136

120
                                         Part II: Number-Crunching Basics
                                                    The median, part of the five-number summary, is shown by the line that cuts
                                                    through the box in the boxplot. This makes it very easy to identify. The mean,
                                                    however, is not part of the boxplot and can’t be determined accurately by
                                                    just looking at the boxplot.
                                                    You don’t see the mean on a boxplot because boxplots are based completely
                                                    on percentiles. If data are skewed, the median is the most appropriate mea-
                                                    sure of center. Of course you can calculate the mean separately and add it to
                                                    your results; it’s never a bad idea to show both.
                                                    Investigating Old Faithful’s boxplot
                                                    The relevant descriptive statistics for the Old Faithful geyser data are found
                                                    in Figure 7-10.
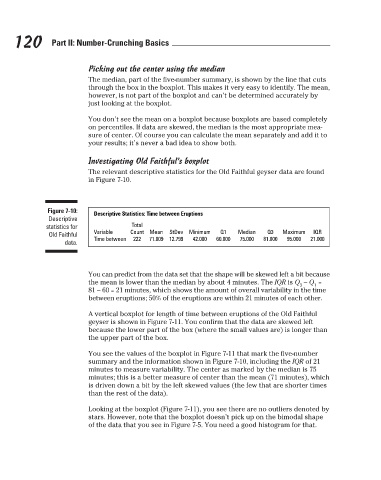
                                        Figure 7-10:   Picking out the center using the median
                                                     Descriptive Statistics: Time between Eruptions
                                         Descriptive
                                        statistics for          Total
                                                                                        Q1
                                                                     Mean
                                                                                                      Q3
                                                                                                                  IQR
                                         Old Faithful   Variable  Count  71.009  StDev  Minimum  60.000  Median  81.000  Maximum  21.000
                                                     Time between
                                                                222
                                                                                              75.000
                                                                                                           95.000
                                                                          12.799
                                                                                 42.000
                                             data.
                                                    You can predict from the data set that the shape will be skewed left a bit because
                                                    the mean is lower than the median by about 4 minutes. The IQR is Q  – Q  =
                                                                                                               3   1
                                                    81 – 60 = 21 minutes, which shows the amount of overall variability in the time
                                                    between eruptions; 50% of the eruptions are within 21 minutes of each other.
                                                    A vertical boxplot for length of time between eruptions of the Old Faithful
                                                    geyser is shown in Figure 7-11. You confirm that the data are skewed left
                                                    because the lower part of the box (where the small values are) is longer than
                                                    the upper part of the box.
                                                    You see the values of the boxplot in Figure 7-11 that mark the five-number
                                                    summary and the information shown in Figure 7-10, including the IQR of 21
                                                    minutes to measure variability. The center as marked by the median is 75
                                                    minutes; this is a better measure of center than the mean (71 minutes), which
                                                    is driven down a bit by the left skewed values (the few that are shorter times
                                                    than the rest of the data).
                                                    Looking at the boxplot (Figure 7-11), you see there are no outliers denoted by
                                                    stars. However, note that the boxplot doesn’t pick up on the bimodal shape
                                                    of the data that you see in Figure 7-5. You need a good histogram for that.


                                                                                                                           3/25/11   8:16 PM
                             12_9780470911082-ch07.indd   120
                             12_9780470911082-ch07.indd   120                                                              3/25/11   8:16 PM
   131   132   133   134   135   136   137   138   139   140   141