
Page 138 - Statistics for Dummies
P. 138
122
Part II: Number-Crunching Basics
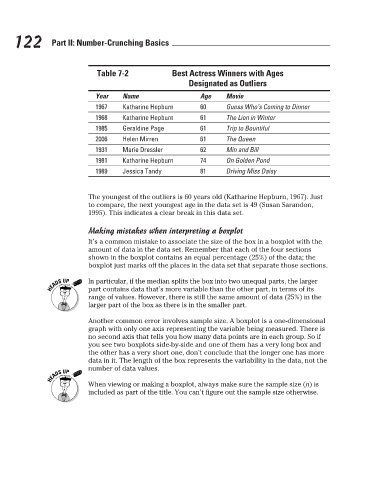
Best Actress Winners with Ages
Table 7-2
Designated as Outliers
Name
Movie
Year
Age
1967
Guess Who’s Coming to Dinner
Katharine Hepburn
60
Katharine Hepburn
1968
The Lion in Winter
61
61
Geraldine Page
1985
Trip to Bountiful
The Queen
61
Helen Mirren
2006
Marie Dressler
Min and Bill
1931
62
74
Katharine Hepburn
1981
On Golden Pond
Jessica Tandy
Driving Miss Daisy
1989
81
The youngest of the outliers is 60 years old (Katharine Hepburn, 1967). Just
to compare, the next youngest age in the data set is 49 (Susan Sarandon,
1995). This indicates a clear break in this data set.
Making mistakes when interpreting a boxplot
It’s a common mistake to associate the size of the box in a boxplot with the
amount of data in the data set. Remember that each of the four sections
shown in the boxplot contains an equal percentage (25%) of the data; the
boxplot just marks off the places in the data set that separate those sections.
In particular, if the median splits the box into two unequal parts, the larger
part contains data that’s more variable than the other part, in terms of its
range of values. However, there is still the same amount of data (25%) in the
larger part of the box as there is in the smaller part.
Another common error involves sample size. A boxplot is a one-dimensional
graph with only one axis representing the variable being measured. There is
no second axis that tells you how many data points are in each group. So if
you see two boxplots side-by-side and one of them has a very long box and
the other has a very short one, don’t conclude that the longer one has more
data in it. The length of the box represents the variability in the data, not the
number of data values.
When viewing or making a boxplot, always make sure the sample size (n) is
included as part of the title. You can’t figure out the sample size otherwise.
3/25/11 8:16 PM
12_9780470911082-ch07.indd 122 3/25/11 8:16 PM
12_9780470911082-ch07.indd 122