Page 133 - Statistics for Dummies
P. 133

Chapter 7: Going by the Numbers: Graphing Numerical Data
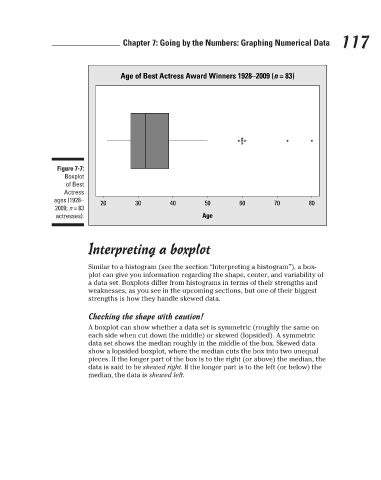
                                                                                              *
                                                                                              **
                                                                                                                 *
                                                                                                           *
                                                                                             *
                                                                                              *
                                           Figure 7-7:
                                             Boxplot
                                             of Best
                                             Actress
                                          ages (1928–
                                                                          40
                                                                 30
                                                                                              60
                                                                                                       70
                                                                                    50
                                          2009; n = 83   20  Age of Best Actress Award Winners 1928–2009 (n = 83)  80     117
                                           actresses).                             Age

                                                    Interpreting a boxplot
                                                    Similar to a histogram (see the section “Interpreting a histogram”), a box-
                                                    plot can give you information regarding the shape, center, and variability of
                                                    a data set. Boxplots differ from histograms in terms of their strengths and
                                                    weaknesses, as you see in the upcoming sections, but one of their biggest
                                                    strengths is how they handle skewed data.
                                                    Checking the shape with caution!
                                                    A boxplot can show whether a data set is symmetric (roughly the same on
                                                    each side when cut down the middle) or skewed (lopsided). A symmetric
                                                    data set shows the median roughly in the middle of the box. Skewed data
                                                    show a lopsided boxplot, where the median cuts the box into two unequal
                                                    pieces. If the longer part of the box is to the right (or above) the median, the
                                                    data is said to be skewed right. If the longer part is to the left (or below) the
                                                    median, the data is skewed left.


                                                                                                                           3/25/11   8:16 PM
                             12_9780470911082-ch07.indd   117                                                              3/25/11   8:16 PM
                             12_9780470911082-ch07.indd   117
   128   129   130   131   132   133   134   135   136   137   138