Page 134 - Statistics for Dummies
P. 134

118
                                         Part II: Number-Crunching Basics
                                                    As shown in the boxplot of the data in Figure 7-7, the ages are skewed right.
                                                    The part of the box to the left of the median (representing the younger
                                                    actresses) is shorter than the part of the box to the right of the median (rep-
                                                    resenting the older actresses). That means the ages of the younger actresses
                                                    are closer together than the ages of the older actresses. Figure 7-3 shows the
                                                    descriptive statistics of the data and confirms the right skewness: the median
                                                    age (33 years) is lower than the mean age (35.69 years).

                                                    If one side of the box is longer than the other, it does not mean that side con-
                                                    tains more data. In fact, you can’t tell the sample size by looking at a boxplot;
                                                    it’s based on percentages, not counts. Each section of the boxplot (the mini-
                                                    mum to Q , Q  to the median, the median to Q , and Q  to the maximum) con-
                                                               1
                                                            1
                                                                                                 3
                                                                                           3
                                                    tains 25% of the data no matter what. If one of the sections is longer than
                                                    another, it indicates a wider range in the values of data in that section (mean-
                                                    ing the data are more spread out). A smaller section of the boxplot indicates
                                                    the data are more condensed (closer together).
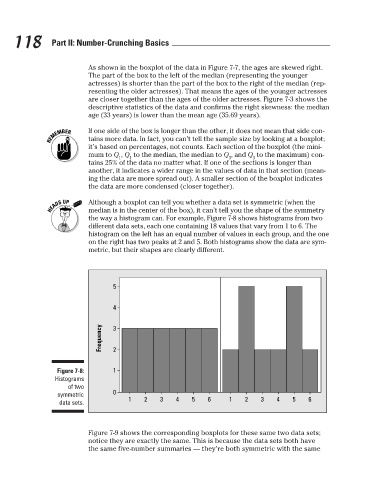
                                                    Although a boxplot can tell you whether a data set is symmetric (when the
                                                    median is in the center of the box), it can’t tell you the shape of the symmetry
                                                    the way a histogram can. For example, Figure 7-8 shows histograms from two
                                                    different data sets, each one containing 18 values that vary from 1 to 6. The
                                                    histogram on the left has an equal number of values in each group, and the one
                                                    on the right has two peaks at 2 and 5. Both histograms show the data are sym-
                                                    metric, but their shapes are clearly different.
                                                           5
                                                           4
                                                       Frequency  3 2
                                           Figure 7-8:     1
                                          Histograms
                                              of two
                                           symmetric       0
                                            data sets.         1   2    3   4    5   6     1   2    3   4    5   6

                                                    Figure 7-9 shows the corresponding boxplots for these same two data sets;
                                                    notice they are exactly the same. This is because the data sets both have
                                                    the same five-number summaries — they’re both symmetric with the same


                                                                                                                           3/25/11   8:16 PM
                             12_9780470911082-ch07.indd   118                                                              3/25/11   8:16 PM
                             12_9780470911082-ch07.indd   118
   129   130   131   132   133   134   135   136   137   138   139